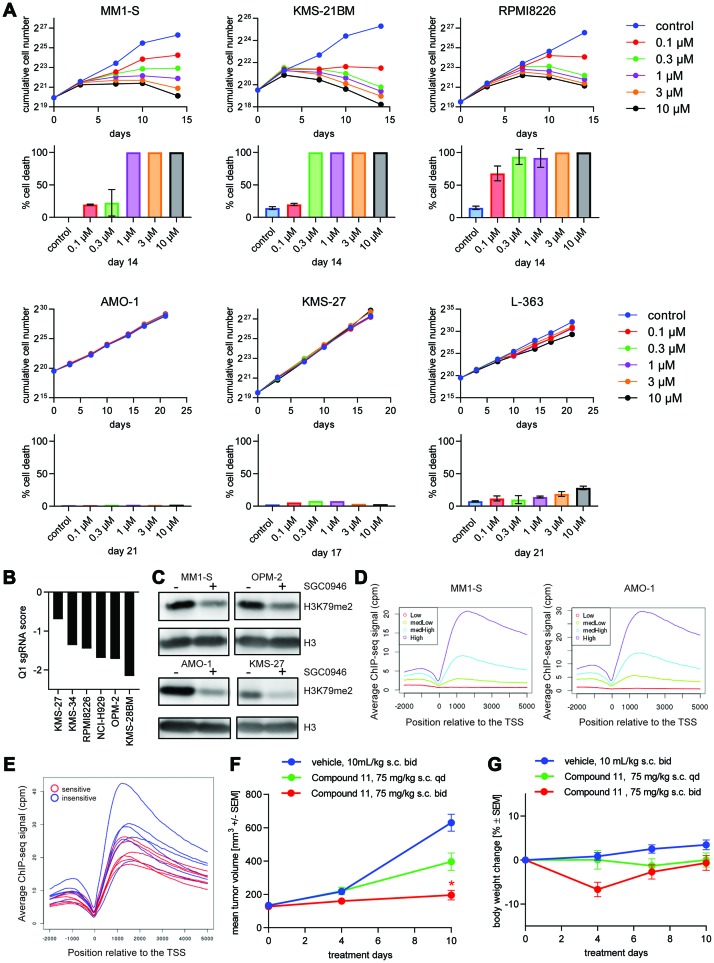
Figure 1. DOT1L inhibition is lethal for a subset of MM cell lines.
(A) Effect of SGC0946 at different concentrations on the growth and viability of 3 sensitive (upper two rows) and 3 insensitive cell lines (lower two rows) over the course of 14–21 days. The theoretical cumulative number of cells, determined with a Casy TT cell counter, and taking into account dilution factors when passaging the cells, is plotted in the first and third row. Cell numbers may include a fraction of dead or dying cells. Trypan Blue dye exclusion was used to reliably quantify % dead cells at endpoint, which is shown below the respective cumulative cell number plots. (B) Bar plot representing the effect of DOT1L knockout on viability of MM cell lines after 14 days in context of a whole-genome CRISPR screen. Log2 ratios of sgRNA representation at day 14 compared to the initial library are depicted on the y-axis. First quartile (Q1) values for each cell line were used to summarize the effect of the 10 sgRNAs targeting DOT1L. (C) Assessment of global H3K79me2 by western blot in MM1-S, OPM-2 (sensitive cell lines), AMO-1 and KMS-27 (insensitive cell lines). (D) H3K79me2 ChIP-seq profiles relative to the TSS for different sets of genes grouped according to their mRNA expression level quantified as counts per million (cpm). (E) Averaged ChIP-seq signal of H3K79me2 for 12 MM cell lines related to the TSS (in blue insensitive cells, in red sensitive cells). (F) Effect of the DOT1L inhibitor Compound 11 on tumor volume in a MM1-S mouse xenograft model. Female NOD-SCID mice bearing MM1-S-luc subcutaneous xenografts were treated with Compound 11 or vehicle control s. c. at indicated dose-schedules. Values are mean ± SEM, n = 8 mice per group. * P-value < 0.05 vs vehicle using Kruskal-Wallis test (Dunn’s post hoc analysis); s. c.: subcutaneous. (G) Body weights for in vivo experiment shown in (F).

