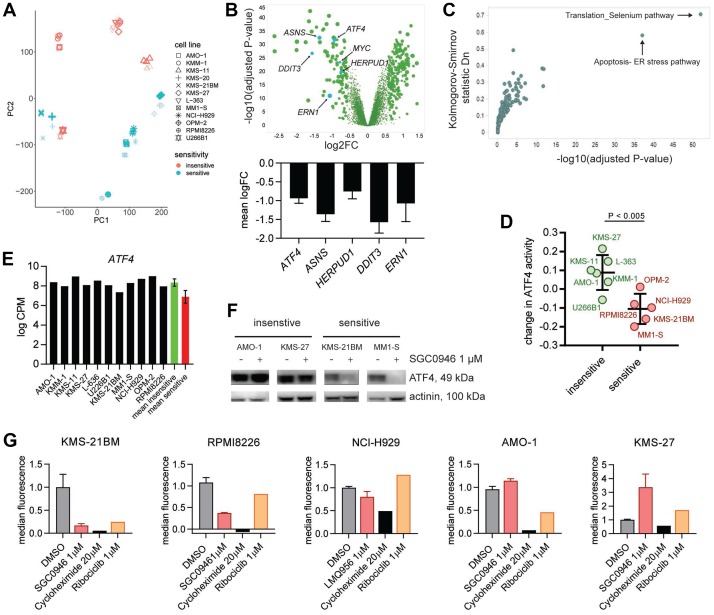
Figure 2. DOT1L inhibition in MM affects the ER stress pathway.
(A) Principal component (PC) analysis of RNA-seq data from 12 MM cell lines treated with vehicle (DMSO, bold symbols) or 1 μM SGC0946 for 6 days. (B) Volcano plot visualizing how sensitive and insensitive cell lines differ with regard to gene expression changes upon SGC0946 treatment (upper panel). The mean of log2-transformed fold changes (logFC) in 6 sensitive cell lines minus the mean logFC in 6 insensitive cell lines is plotted on the x-axis. P-values derived from comparison of expression changes in sensitive versus insensitive lines for the respective genes are plotted on the y-axis. Bar graphs showing logFC (mean ± s. d.) for 5 genes related to the ER stress pathway (lower panel). (C) Pathway analysis of the genes preferentially downregulated in sensitive versus insensitive cell lines upon DOT1L inhibition. (D) Change in activity of the TF ATF4 determined by ISMARA in sensitive and insensitive cell lines upon treatment with 1 μM SGC0946 compared to DMSO. Suppression of ATF4 activity was significantly stronger in sensitive cell lines (P-value < 0.005, t-test). Mean ± s. d. is indicated. (E) Basal level of ATF4 expression in the different MM cell lines. No significant difference between sensitive and insensitive cell lines (P- value > 0.05). Mean ± s. d. for red and green bar; cpm: counts per million. (F) Assessment of ATF4 by western blot in different sensitive (KSM-21BM and MM1-S) and insensitive cell lines (AMO-1 and KMS-27) treated with either 1 μM SGC0946 or DMSO. (G) Quantification of mean fluorescence intensity in HPG+ cells by flow cytometry as indicator of protein synthesis. Cells were pretreated for 7 days with either 1 μM SGC0946 or DMSO or 1 μM ribociclib. A treatment with 20 μM cycloheximide for 8 h was included as control. Bar graphs show the mean ± s. d. normalized to DMSO control, cycloheximide and ribociclib: n = 1.

