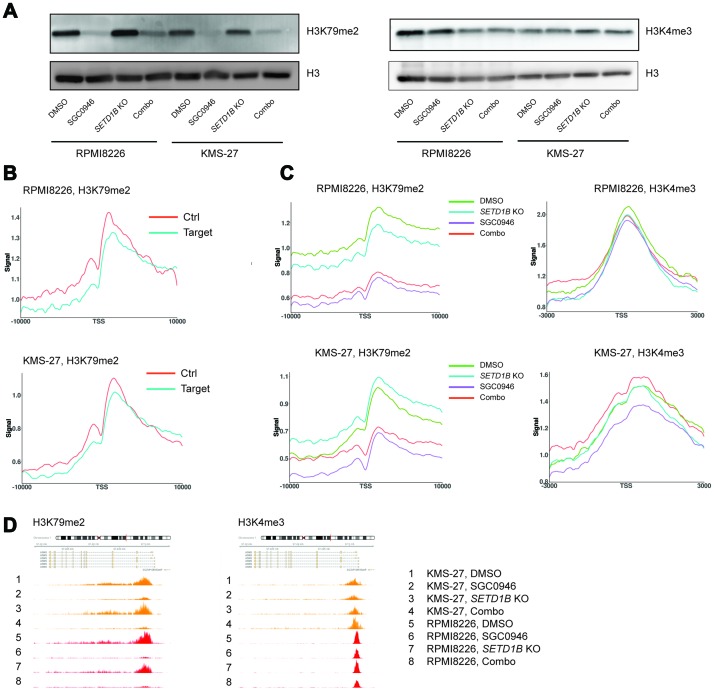
Figure 6. Genome-wide profiles of H3K79me2 and H3K4me3 upon perturbation of DOT1L and SETD1B.
(A) Assessment of H3K79me2 and H3K4me3 by western blot in RPMI8226 Cas9 and KMS-27 Cas9 cells containing inducible sgSETD1B, treated for 4 days with either DMSO, 1 μM SGC0946, 100 ng/ml dox or a combination of SGC0946 and dox. (B) ChIP-seq H3K79me2 metagene profiles around the TSS of DOT1L target genes compared to control genes with similar expression levels in RPMI8226 and KMS-27 Cas9 cells at basal level (DMSO treatment). (C) ChIP-seq H3K79me2 and H3K4me3 metagene profiles around the TSS of DOT1L target genes in RPMI8226 and KMS-27 Cas9 cells containing inducible sgSETD1B, treated as in (A). (D) ChIP-seq tracks representing signal for H3K79me2 and H3K4me3 around ASNS gene in RPMI8226 Cas9 cells (orange) and KM-S27 Cas9 cells (red), treated as in (B).

