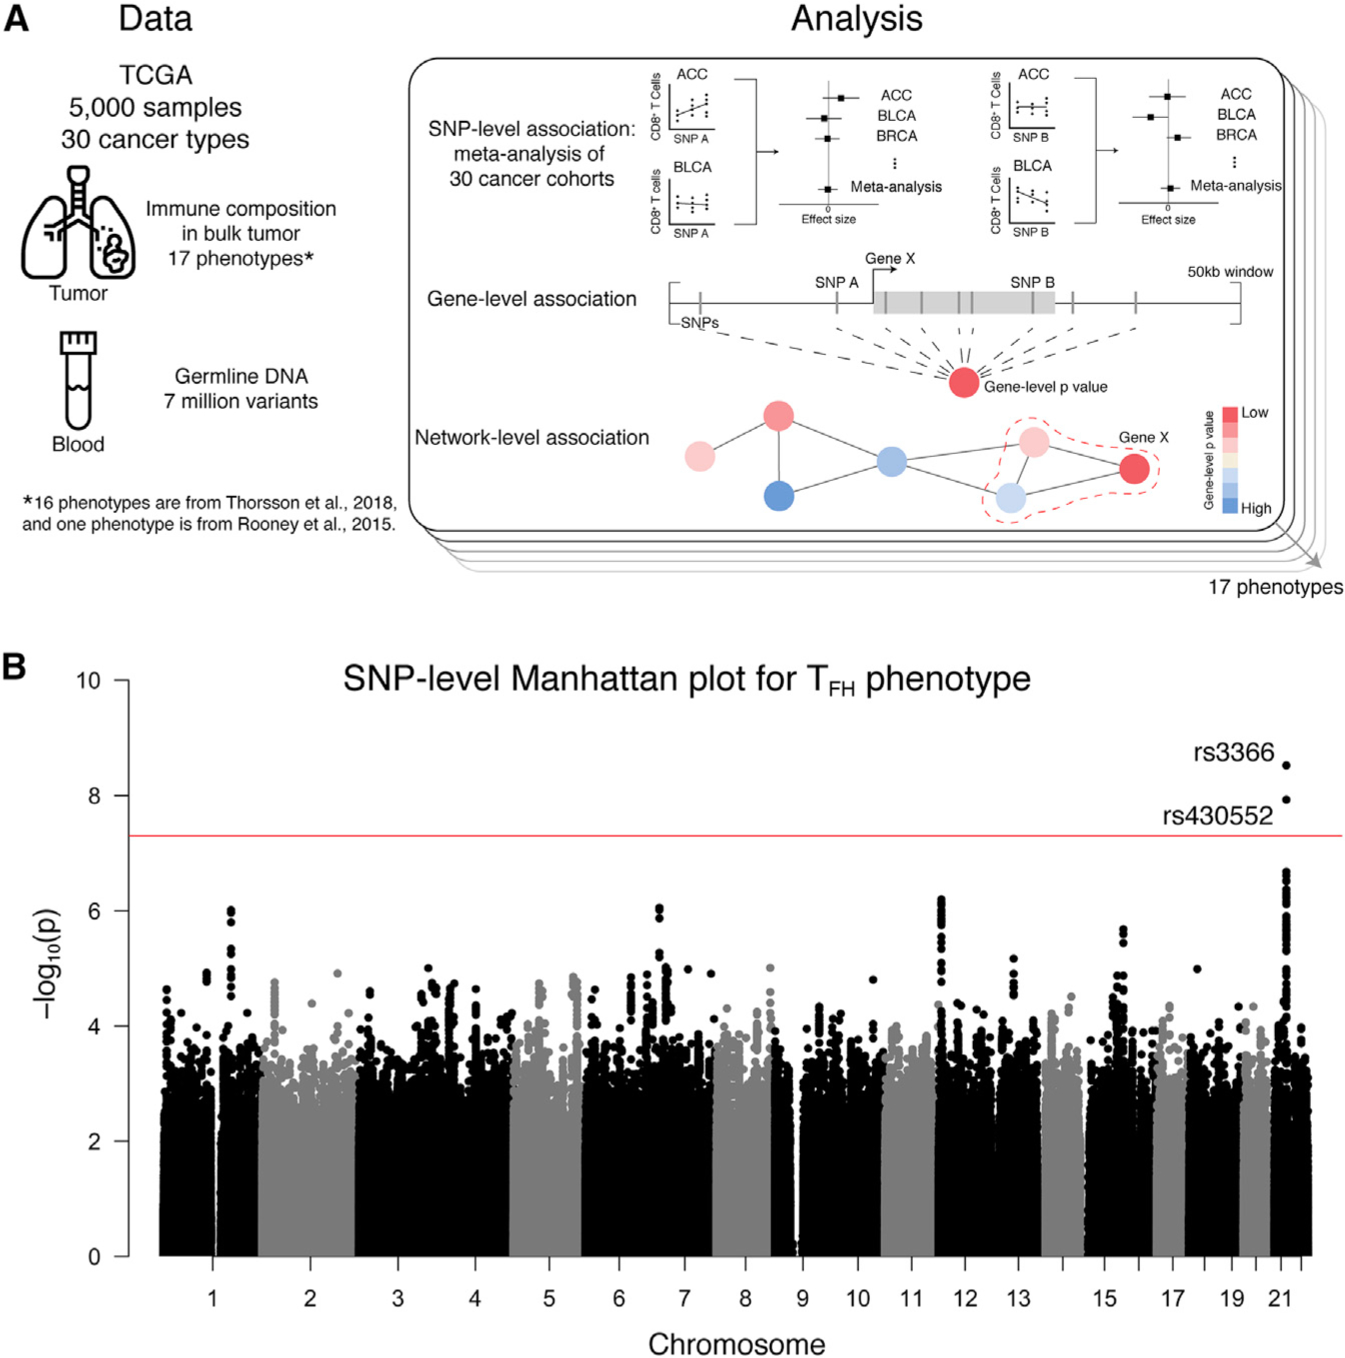
Figure 1. Association Study Approach and GWAS Results.

(A) Schematic showing the type and size of dataset for association studies. Association studies are conducted at three genomic scales across all 17 phenotypes. (B) Manhattan plot for GWAS meta-analysis for the TFH cell phenotype. Positions along the chromosomes are on the x axis, and −log10-transformed p values are on the y axis. Every autosome is represented, but some are unlabeled for visualization purposes. The red line indicates genome-wide significance (p < 5 × 10⁻⁸). See also Figure S1.
