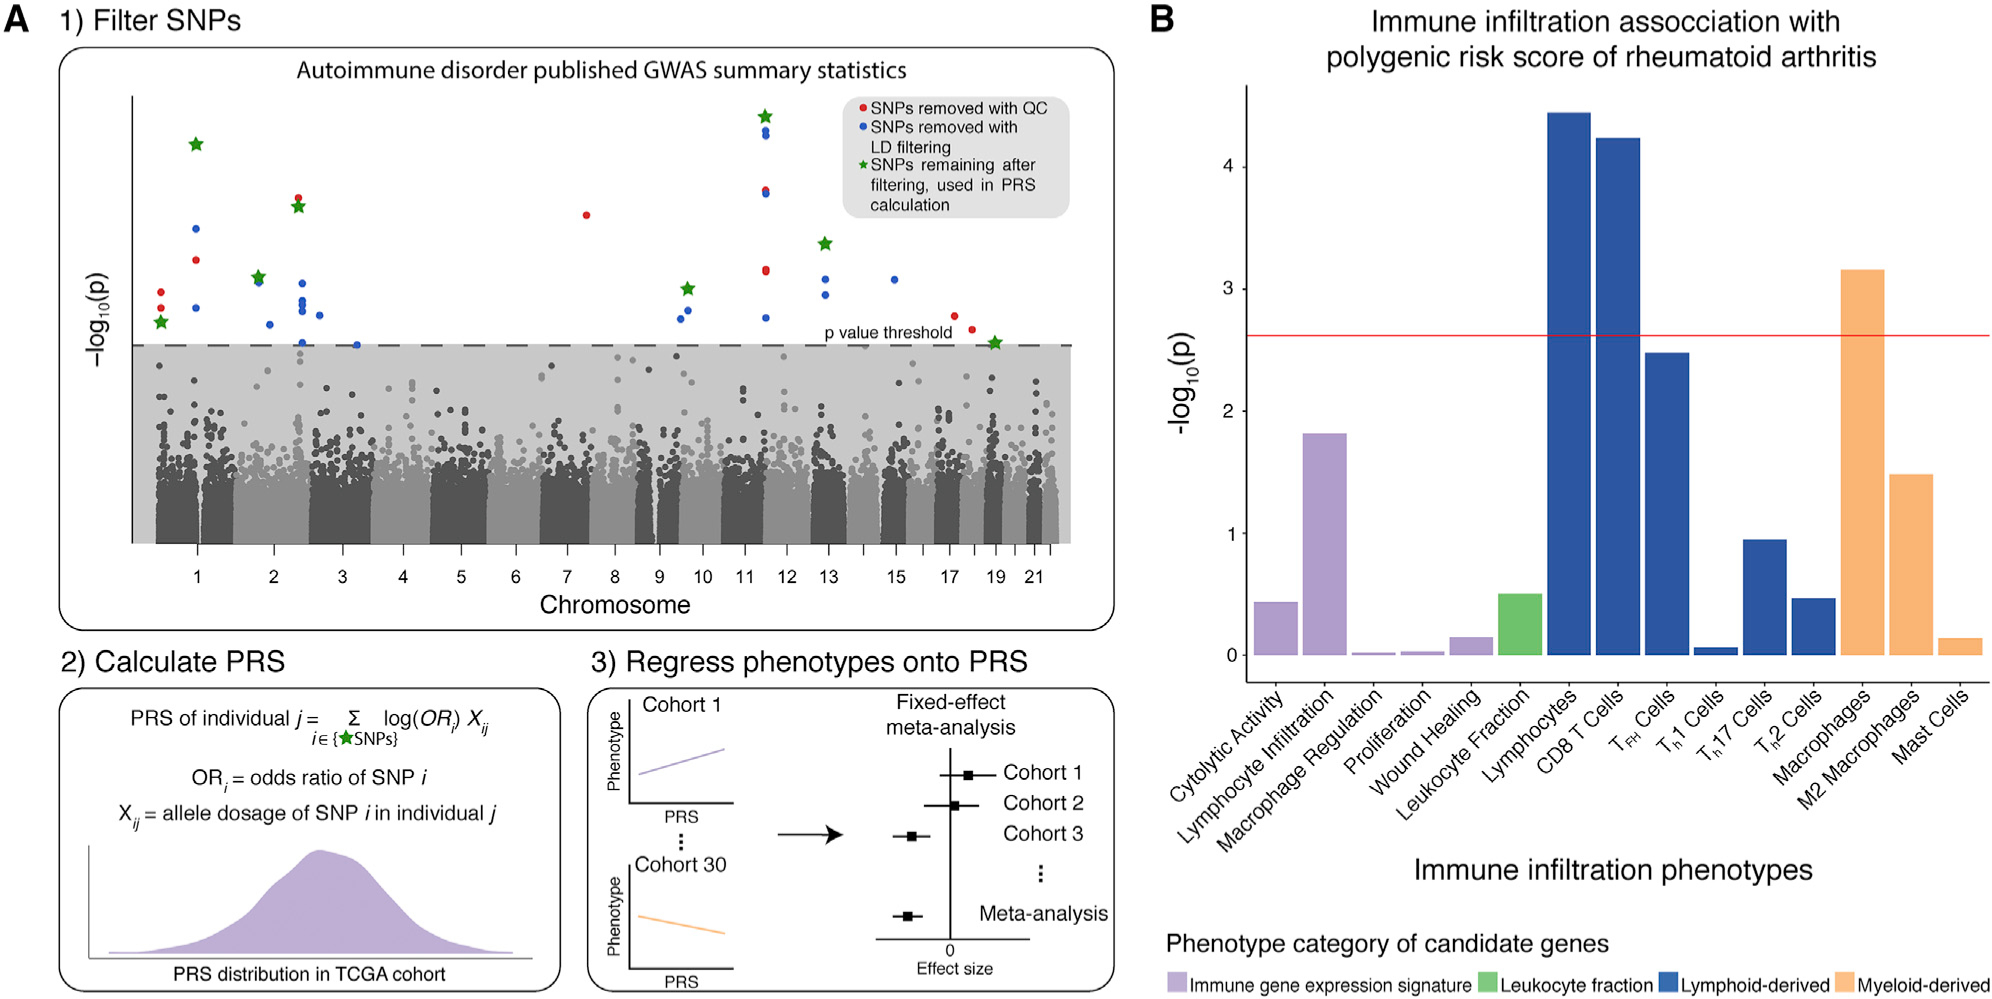
Figure 4. PRS Associations with Immune Infiltration.

(A) Workflow for calculating polygenic risk scores (PRSs) of autoimmune disorders based on published GWAS summary statistics, followed by regression of the 17 immune infiltration phenotypes onto PRS.
(B) Bar plot showing the strength of association between the phenotypes and PRS for rheumatoid arthritis. The phenotypes are on the x axis, and −log10-transformed p values are on the y axis. Each bar is colored according to the phenotype category. The red line indicates the Bonferroni-corrected significance value (p < 0.0029).
