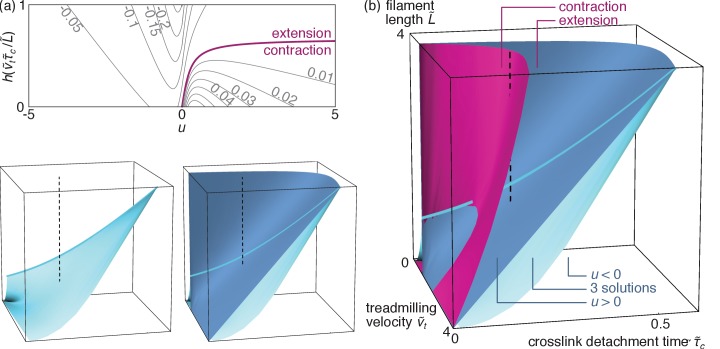
Figure 5. Bundle tension.
(a) Level curves for the dimensionless bundle tension as a function of the apparent velocity determined from Equation 4 and pictured in Figure 4d, and the ratio . The purple line separates contraction from extension. (b) Contraction regimes associated with the stable solution (purple surface) and velocity regimes as in Figure 4c (blue surfaces) as a function of the dimensionless parameters , and . The blue surfaces are plotted separately on the bottom left to facilitate visualization (axes are as in the main figure), and cuts through the 3D diagram are shown in the appendix. As discussed above the ‘three solutions’ regime comprised between these two surfaces has coexisting stable and solutions. The light blue line outlines the intersection between the two blue surfaces. The dashed line materializes one set of reasonable experimental parameters (see text), and goes from to through the coexistence (‘three solutions’) region, implying a first-order transition. By contrast, a similar vertical line shifted to smaller values of would describe a second-order transition.

