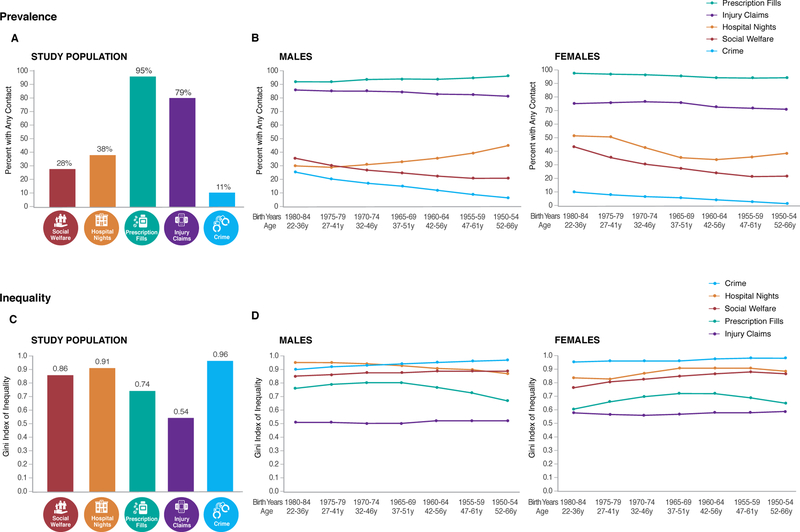
Figure 2. Inequality in the distributions of poor health, crime, and social welfare.
The figure shows that contact with health and social sectors is common, but use-events are highly concentrated. Prevalence estimates indicate the percentages of the NZIDI study population (Panel A) and each age-and-sex grouping (Panel B) that had any contact with the five health and social sectors during the 10-year observation period (July 2006-June 2016). The Gini coefficients indicate the degree of inequality in the distribution of use-events in each sector, for the study population (Panel C) and each age-and-sex grouping (Panel D). Gini coefficients can range from 0.0 (perfect equality) to 1.0 (perfect inequality). Study population N=1,711,590.a
aRandomly rounded to a base of three, per the confidentiality rules of Statistics New Zealand.

