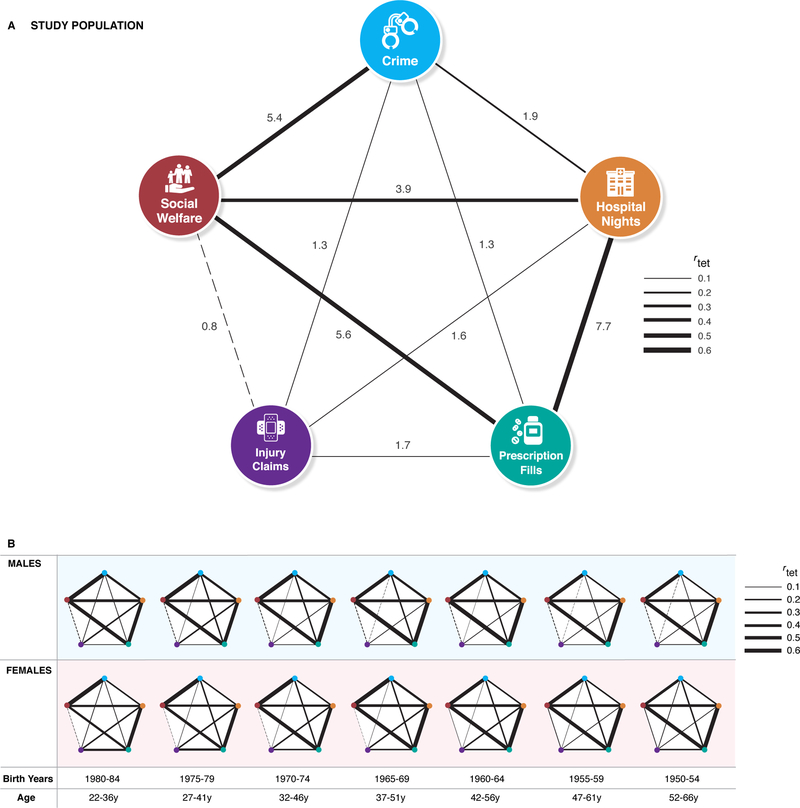
Figure 4. Aggregation of poor health, crime, and social-welfare dependency.
The figure shows that high-need users in one sector were more likely to reappear as high-need in other sectors too (with the exception of the relation between social welfare and injury claims). Estimates are odds ratios. The corresponding tetrachoric correlations (rtet) were used to scale the bars. Dashed lines indicate a negative correlation. Odds ratios, 95% confidence limits, and p-values for the NZIDI study population and each age-and-sex grouping are reported in Supplementary Tables 3 and 4.

