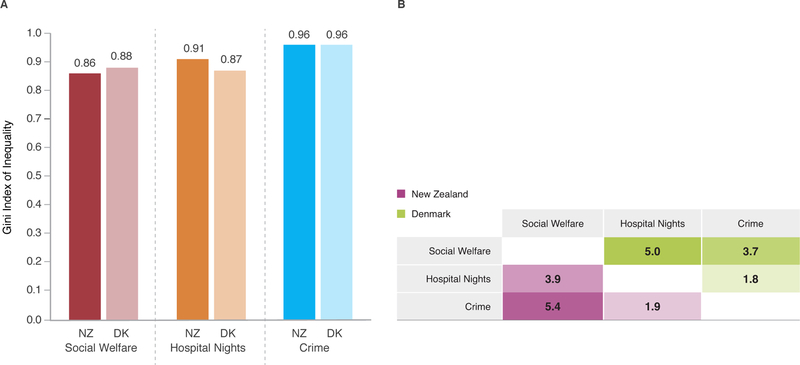
Figure 5. Replication in Danish nationwide registers linked to 2.3 million citizens.
Concentration and aggregation were also evident in Danish nationwide registers. Gini coefficients of inequality in the Danish registers were strikingly similar to those in the New Zealand registers (Panel A). Also consistent with findings in the NZIDI, high-need users in one sector were more likely to reappear as high-need in other sectors too (Panel B). Estimates in Panel B are odds ratios. The 95% confidence limits are as follows: social welfare with hospital nights (NZ=3.94 [3.89, 4.00], DK=5.00 [4.94, 5.05]); social welfare with crime (NZ=5.35 [5.28, 5.42], DK=3.74 [3.69, 3.78]); hospital nights with crime (NZ=1.93 [1.90, 1.96], DK=1.75 [1.73, 1.78]). P-values for all associations are <0.001. NZ=New Zealand, DK=Denmark.

