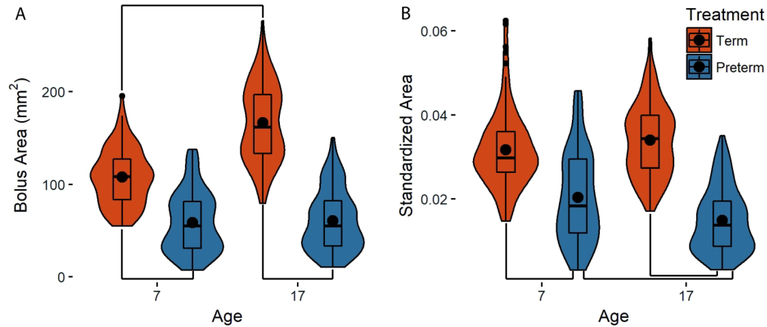
Figure 1.
Size of the bolus in term (orange) and preterm (blue) pigs at day seven and 17. (A) Raw area (B) Bolus area standardized by the square of the length of the palate. Black dots: means for each group; lines between groups: statistically significant differences as identified with post-hoc analyses; width of each plot: distribution of the data along the y-axis.

