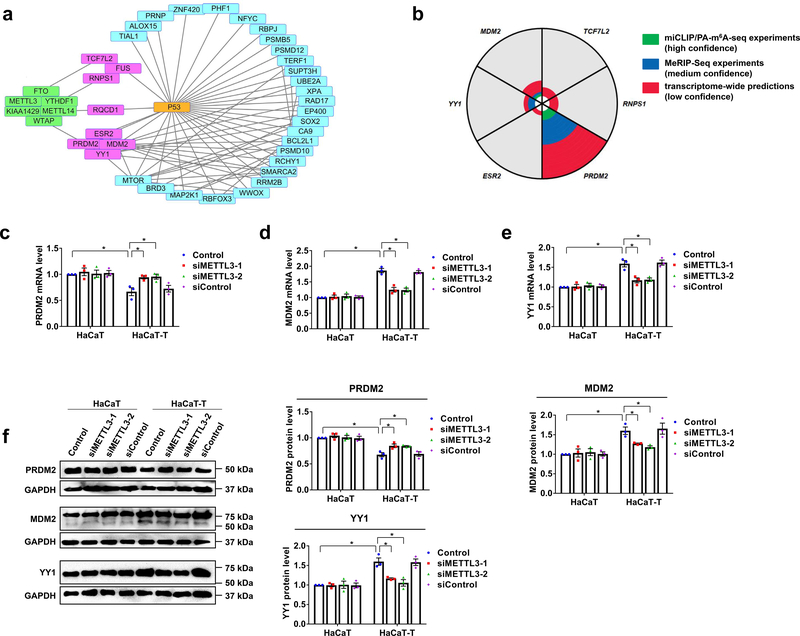
Fig. 5. Three p53 regulators are affected by m6A methylation in HaCaT-T cells.
a, Protein relation analysis on m6A regulating proteins, p53, and genes with altered expressions in HaCaT cells after chronically exposed to low dose of NaAsO2 (GSE97303) was performed by String. The genes in pink and blue rectangles differentially express in HaCaT cells chronically exposed to NaAsO2 compared to HaCaT cells. The proteins in green rectangles are m6A regulating proteins. The genes in pink rectangles are involved in NaAsO2-induced malignant transformation and associated with m6A methylation and p53. Straight lines represent two molecules are close related. b, The analysis of m6A sites in genes which are involved in NaAsO2-induced malignant transformation and associated with m6A and p53 was performed in m6AVAR. The “green” means there are m6A sites in this gene from miCLIP/PA-m6A-seq experiments with high confidence. The “blue” indicates there are m6A sites in this gene from MeRIP-Seq experiments which is medium confidence. The “red” suggests there are m6A sites in this gene from transcriptome-wide predictions with low confidence. The area of “green”, “blue”, or “red” represents the relative counts of m6A sites in this gene. c-e, The mRNA levels of three genes including PRDM2 (c), MDM2 (d), and YY1 (e) were tested by RT-qPCR in HaCaT and HaCaT-T cells with introduction of two siMETTL3 (siMETTL3–1 and siMETTL3–2) and siControl. f, The representative images of PRDM2, MDM2, YY1, and GAPDH protein (left). Quantitative protein levels of PRDM2, MDM2, and YY1 protein in HaCaT and HaCaT-T cells with introduction of METTL3 siRNA were detected by western blotting (right). For c-f, n = 3 biological replicates, error bars indicate mean ± SEM. The P-values were determined by two-tailed t-test. “*” indicates a significant difference compared to control group (P < 0.05).

