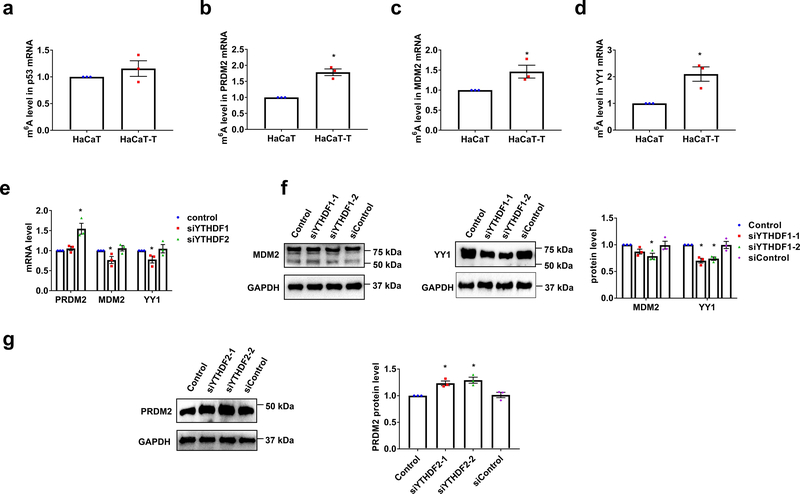
Fig. 6. m6A methylation inhibits PRDM2 expression and increases MDM2 and YY1 levels in HaCaT-T cells.
a-d, m6A levels in p53 (a), PRDM2 (b), MDM2 (c), and YY1 (d) mRNA of HaCaT and HaCaT-T cells were determined by MeRIP. e, The mRNA levels of PRDM2, MDM2, and YY1 in HaCaT-T cells with introduction of YTHDF1 siRNA (siYTHDF1) or YTHDF2 siRNA (siYTHDF2) were tested by RT-qPCR. f, The representative images of MDM2 (left) and YY1 (middle) in HaCaT-T cells with introduction of two YTHDF1 siRNA (siYTHDF1–1 and siYTHDF1–2). Quantitative protein levels of MDM2 and YY1 in HaCaT-T cells with introduction of two YTHDF1 siRNA were detected by western blotting (right). g, The representative images (left) of PRDM2 in HaCaT-T cells with introduction of two YTHDF2 siRNA (siYTHDF2–1 and siYTHDF2–2). Quantitative protein levels of PRDM2 in HaCaT-T cells with introduction of two YTHDF2 siRNA were detected by western blotting (right). For a-g, n = 3 biological replicates, error bars indicate mean ± SEM. The P-values were determined by two-tailed t-test. “*” indicates a significant difference compared to control group (P < 0.05).

