
Figure 2:
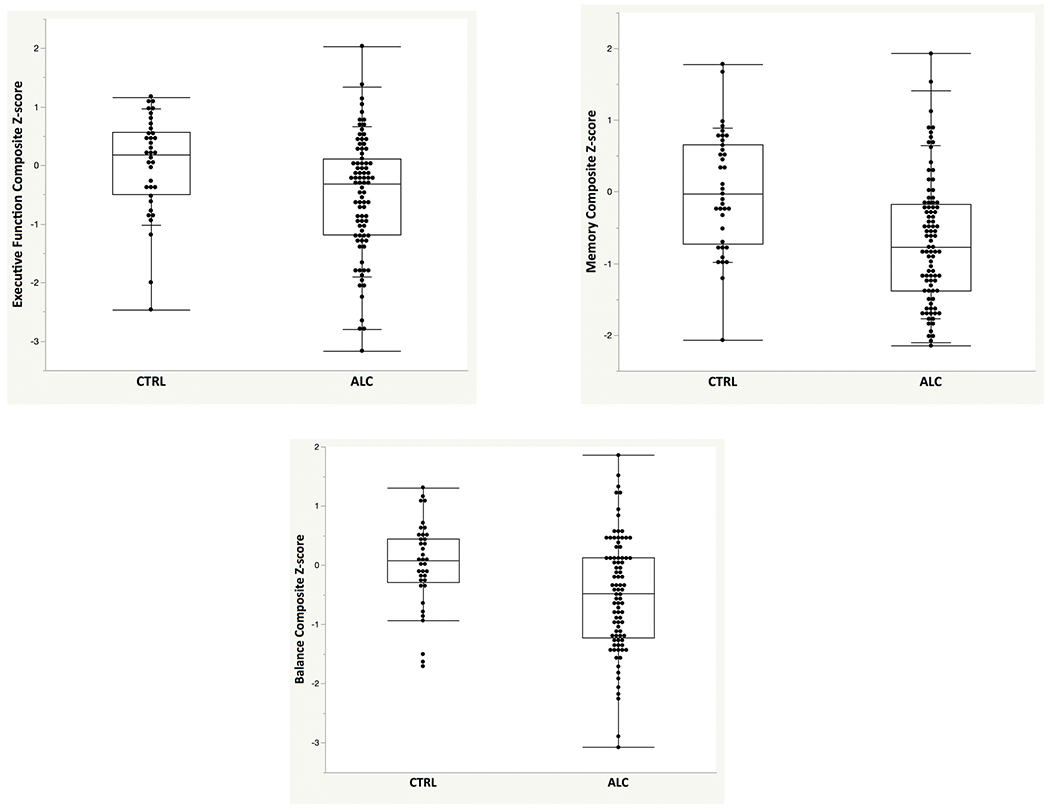
Box plots with individual data points depicting age- and education-corrected Z-scores (based on the control group: mean=0, standard deviation=1) for executive functions (EF), memory (MEM), and static balance (BAL) scores for the ALC and CTRL groups.