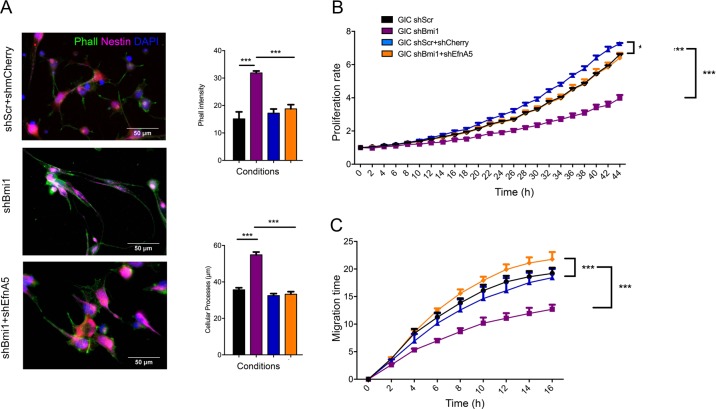
Fig. 5. EfnA5 silencing rescues Bmi1kd mGIC properties.
a Immunocytochemistry and corresponding quantification for phalloidin (green) and Nestin (magenta) shows that the increase of stress fibres and cellular processes length depends on the upregulation of EfnA5. Endogenous mCherry is shown in red (n = 3). b Quantitative analysis of the proliferation rate showing that Bmi1 promotes mGIC proliferation by repressing EfnA5. (n = 6). c Quantification of the migration rate reveals that high EfnA5 expression inhibits the migratory capacity of mGIC (n = 6). *p < 0.05; **p < 0.01; ***p < 0.001; ****p < 0.0001; error bars represent ±SEM. Scale bars represent 50 µm in a and 100 µm in b.

