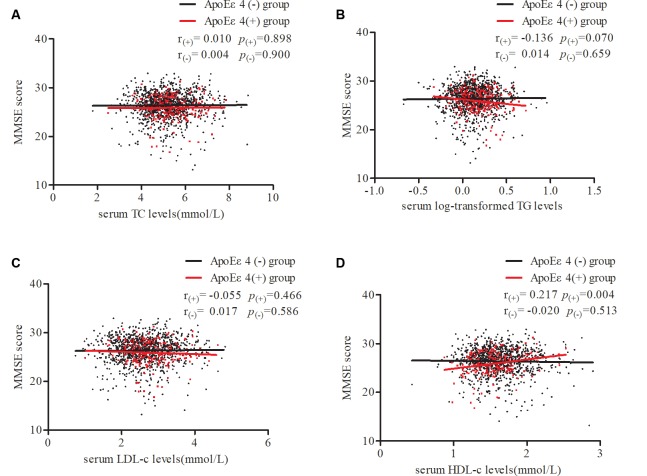
Figure 3.
Partial correlations of MMSE score and serum lipid levels according APOE ε4 status. Participants were divided into two groups: APOE ε4 carriers and non-carriers, which are represented by red dots and black dots. Partial linear correlations between MMSE scores and serum TC (A), log-transformed TG (B), LDL-c (C), and HDL-c (D) levels are shown in the figure. r(+) and p(+) represent partial correlation coefficients in carriers, while r(-) and p(-) represent non-carriers. Adjusted for age, sex, education, smoking, drinking, intensity of physical activity, body mass index (BMI), log-transformed fasting blood glucose (FBG), mean arterial pressure, pulse rates, and heart disease. TC, total cholesterol; TG, triglycerides; LDL-c, low-density lipoprotein; HDL-c, high-density lipoprotein; APOE, apolipoprotein E.

