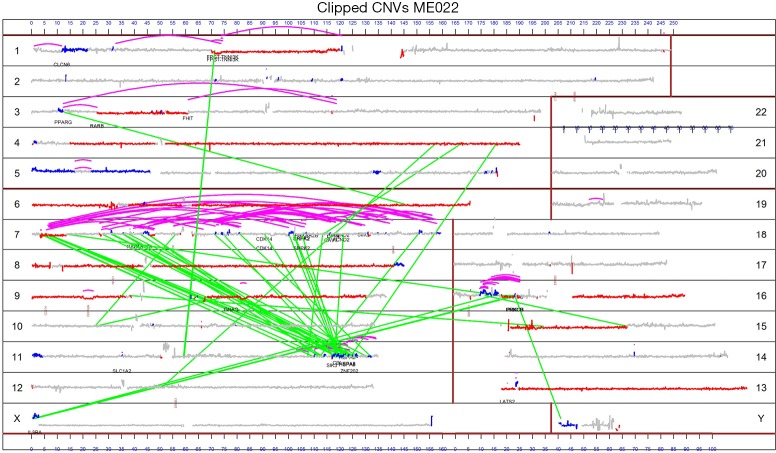
Figure 2.
Genome plot of malignant pleural mesothelioma (MPM) with chromothripsis and chromoplexy. In this genome plot of specimen ME022 the chromosomes are plotted in order by size as numbered near the margins. Curved pink lines represent intra-chromosomal rearrangements whereas light green lines represent inter-chromosomal rearrangements. Deletions are represented in red and amplifications are represented in blue. Some genes relevant to MPM or cancer in general are labeled in blue. Accordingly, the multiple pink lines on chromosome 7 represent chromothripsis and the green lines between chromosomes 7 and 11 represent chromoplexy. This figure was previously published and is used with permission from the International Association for the Study of Lung Cancer (10). CNV, copy number variation.

