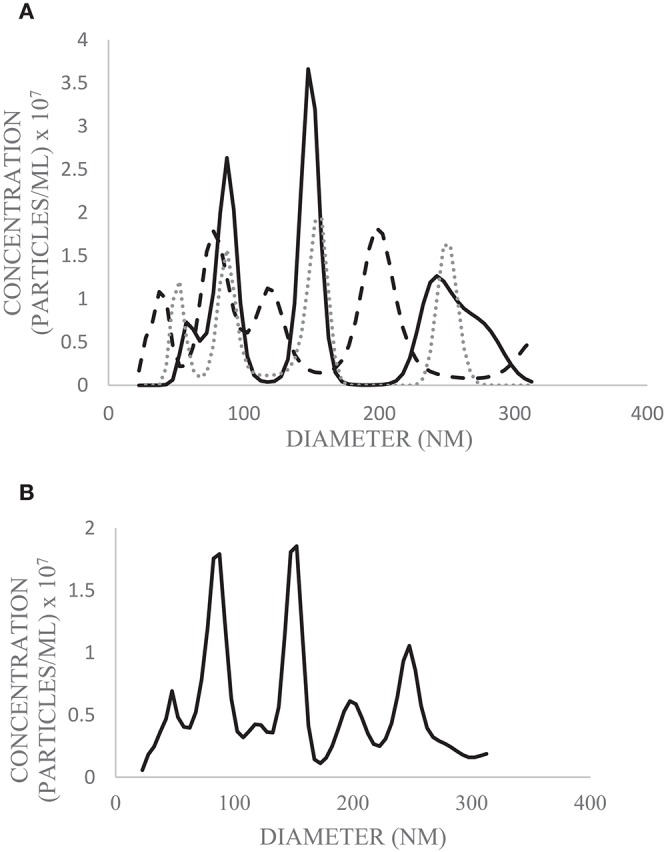
Figure 3.

Diameter and concentration of human milk EVs from pooled human donor milk measured by NTA. Technical replicates were performed in triplicate (solid line = trial 1; dashed line = trial 2; dotted line = trial 3) (A) and the average of the three runs was calculated (B). The above graphs are plotted from the 10th−90th percentile of EV sizes (22.5–312.5 nm) to exclude particles which do not meet the size criterion for likely EVs.
