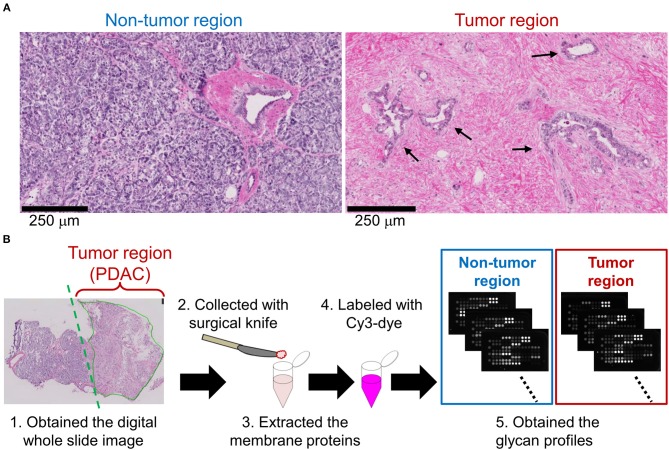
Figure 1.
Differential glycomic profiling of PDAC tissue sections. (A) Representative images of non-tumor and tumor regions in hematoxylin and eosin-stained frozen sections. The arrows indicate the cancerous ducts. (B) Schematic overview of lectin microarray-based glycomic profiling of unstained frozen sections.

