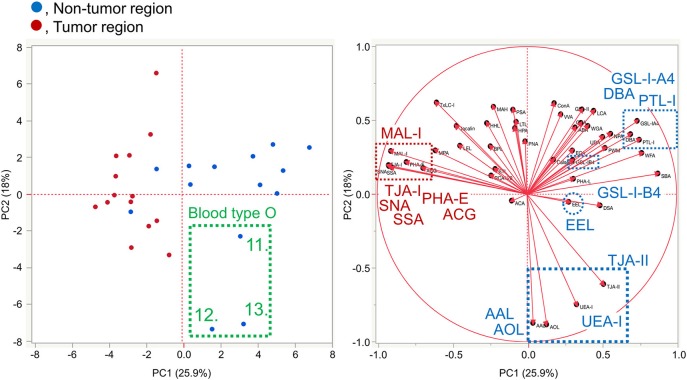
Figure 3.
Multivariate analysis of the tissue glycomic profiles by PCA. In the score plot (left panel), the lectin microarray data of the non-tumor (blue) and tumor (red) regions of PDAC tissue sections (N = 14) were plotted. The numbers of three non-tumor samples obtained from O blood group patients (No. 11–13) are indicated. In the loading plot (right panel), the relative signal intensities of 45 lectins on the array are plotted. The lectins extracted for the non-tumor and tumor regions are indicated in blue and red, respectively.

