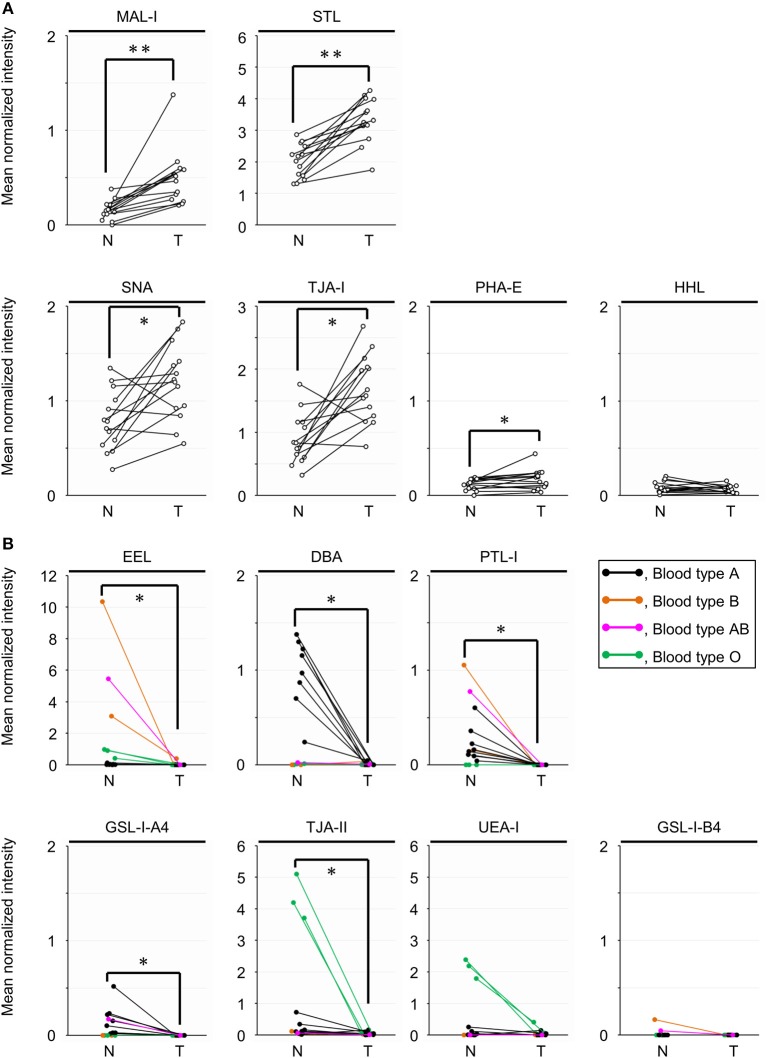
Figure 6.
Univariate analysis of the glycan profiles of basigin derived from the non-tumor (N) and tumor (T) regions of PDAC tissue sections. (A) Comparison of the relative signal intensities of the six lectins that showed extremely significant differences (P = 0.0001) in the differential glycan profiling of basigin and/or in the differential tissue glycomic profiling (Figure 2A). (B) Comparison of the relative signal intensities of the seven lectins recognizing ABO blood group antigens. N = 14 for each region. *P < 0.05, **P = 0.0001. The median and P-values are summarized in Table 2.

