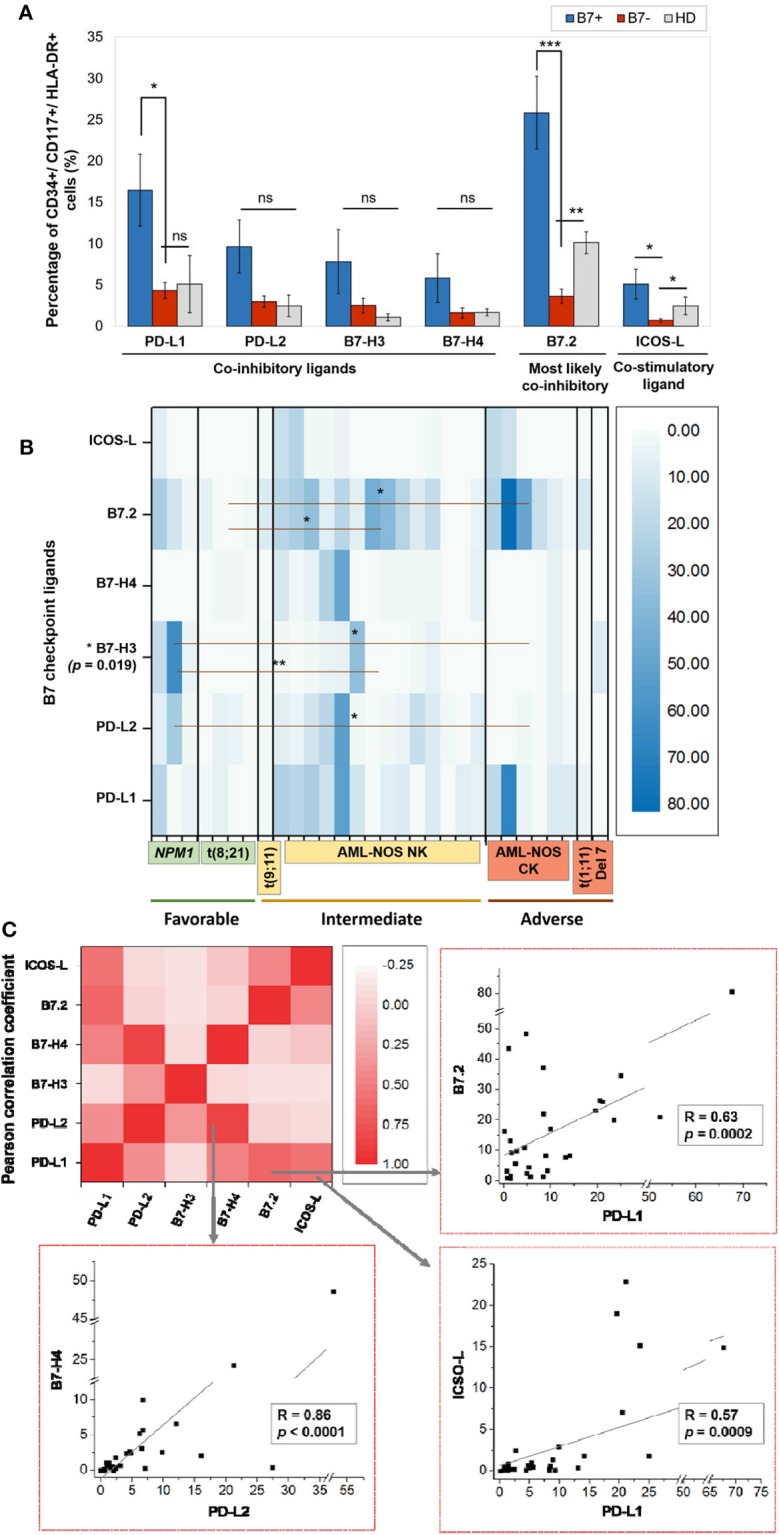
Figure 1.

(A) Percentage of CD34+/CD117+/HLA-DR+ cells expressing the indicated B7 checkpoint ligands in patients, categorized as B7+ (n = 18) or B7– (n = 12) based on the B7 ligand expression and healthy donors (HD, n = 4). Bars represent the mean ± SEM (***P < 0.001, **P < 0.01, *P < 0.05; ns, not significant; two-tailed t-test, Mann–Whitney test). (B) Heat map of percentages of acute myeloid leukemia (AML) blasts expressing the indicated B7 checkpoint ligands in patients categorized based on their corresponding European Leukemia Net (ELN) risks: favorable, intermediate, and adverse (**P < 0.01, *P < 0.05; two-tailed t-test). (C) Heat map of B7 ligand co-expression. Pearson correlation coefficients (R) were computed, and ANOVA test was used to validate the significance of the identified correlations.
