Figure 2.
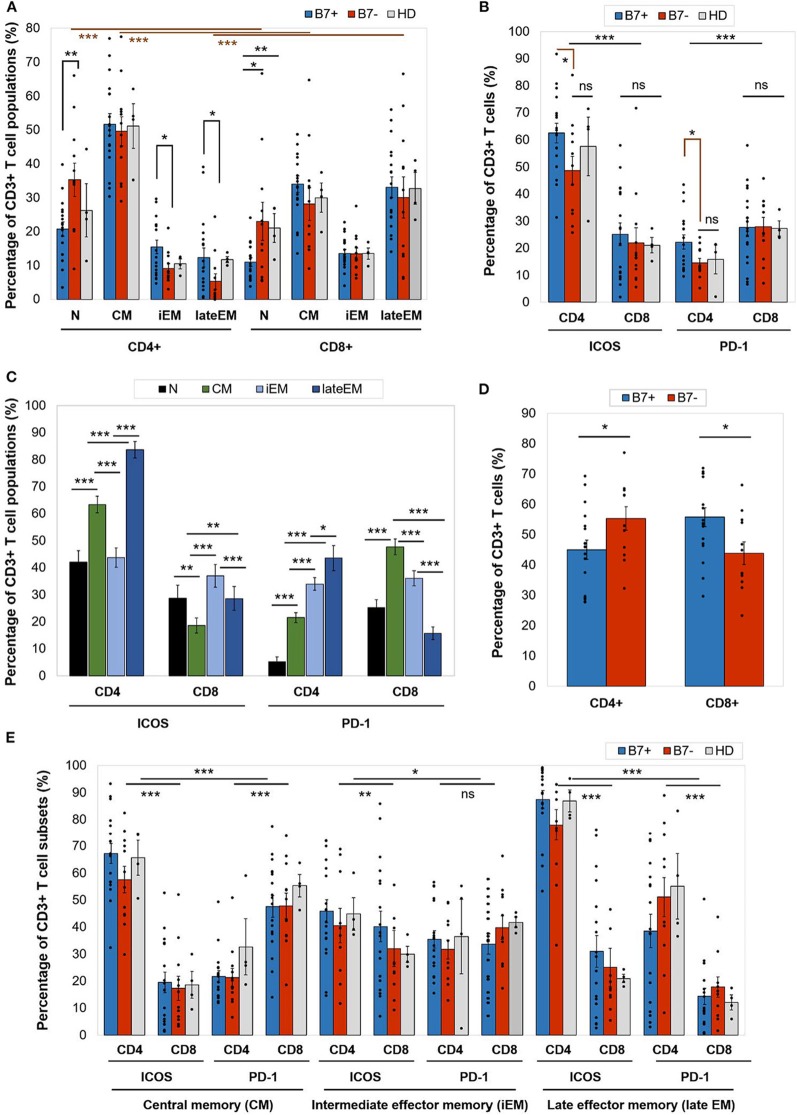
(A) Percentage of CD4+ or CD8+ T cell populations—naive (N), central memory (CM), intermediate effector memory (iEM), and late effector memory (late EM)—in AML patients (either B7+, n = 18, or B7–, n = 12) and healthy donors (HD, n = 4). Individual values are represented as points. Bars represent the mean ± SEM (**P < 0.01, *P < 0.05; two-tailed t-test, Mann–Whitney test). (B) Expression of immune checkpoint receptors [inducible T cell costimulator (ICOS) and programmed death 1 (PD-1)] on CD4+ or CD8+ T cells in AML patients (either B7+, n = 18, or B7-, n = 12) and healthy donors (HD, n = 4). Individual values are represented as points. Bars represent the mean ± SEM (***P < 0.001, *P < 0.05; ns, not significant; two-tailed t-test and two-way ANOVA). (C) Expression of immune checkpoint receptors (ICOS and PD-1) on CD4+ or CD8+ T cells populations—N, CM, iEM, and late EM—in AML patients. Bars represent the mean ± SEM (n = 30; ***P < 0.001, **P < 0.01, *P < 0.05; two-tailed paired t-test). (D) Percentage of C4+ or CD8+ T cells in AML patients (either B7+, n = 18, or B7–, n = 12). Individual values are represented as points. Bars represent the mean ± SEM (*P < 0.05; two-tailed t-test). (E) Expression of immune checkpoint receptors (ICOS and PD-1) on CD4+ or CD8+ T cells populations—CM, iEM, and late EM—in AML patients (either B7+, n = 18, or B7–, n = 12) and healthy donors (HD, n = 4). Individual values are represented as points. Bars represent the mean ± SEM (***P < 0.001, **P < 0.01, *P < 0.05; ns, not significant; two-way ANOVA).

