
Fig. 3. Relative abundance of 15N-incorporators in the incubation in which they were identified, as well as the corresponding raw (unincubated) sediment.
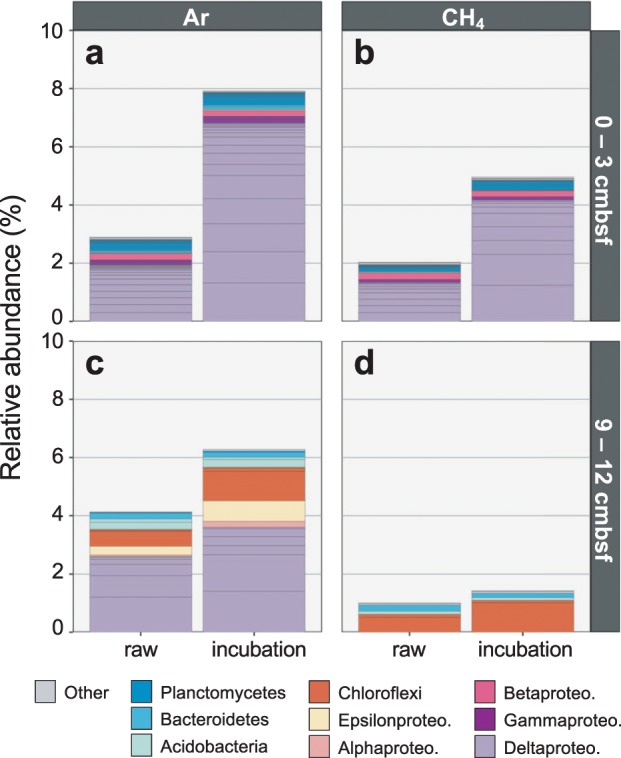
Relative abundances shown for 0–3 cmbsf samples incubated with argon (a) or methane (b) and 9–12 cmbsf samples incubated with argon (c) or methane (d). Lineages that accounted for >0.1% of 16S rRNA gene reads in at least one sample are colored by class (for Proteobacteria only) or phylum. Low abundance lineages (i.e., <0.1% of reads in each sample) are grouped as ‘Other’. Internal bar lines show relative abundances of individual ASVs.