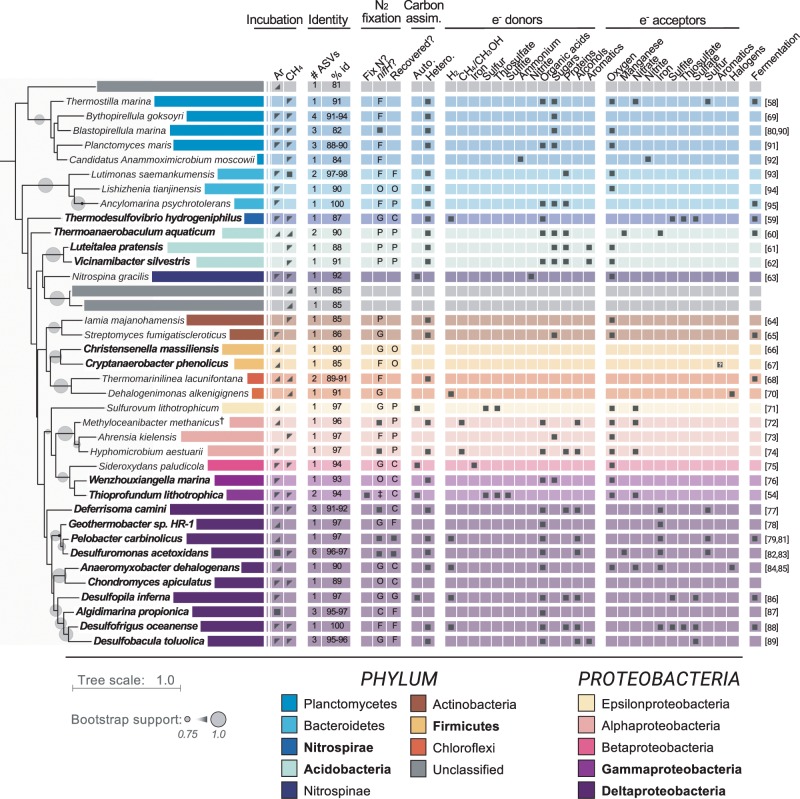
Fig. 5. Metabolic profiles of the 15N-incorporators’ closest characterized relatives [54, 58–95].
Empty cells indicate metabolisms not tested or not found to support growth. Bold taxon names indicate 15N-incorporators within phyla or classes (Proteobacteria only) for which nifH sequences were also detected. Incubation column: Indicates the headspace (‘Ar’ or ‘CH4′) and sediment horizon (0–3 cmbsf, shaded top left corner; 9–12 cmbsf, shaded bottom right corner; both, full shaded square) for which taxa were identified as 15N-incorporators. Identity column: ‘# ASVs’ indicates number of ASVs identified as 15N-incorporators that shared the same closest relative; ‘% id’ indicates percent sequence identity to closest relative across the amplified V4/V5 16S rRNA gene region (~370 bp). N2 fixation column: ‘Fix N?’ indicates if closest relative previously shown to fix nitrogen (dark square); ‘nifH?’ indicates if relative contains a copy of nifH in its genome (dark square) or the relative’s lowest taxonomic rank that contains an organism with a copy of nifH (P phylum, C class, O Order, F Family, G Genus); ‘Recovered?’ indicates if one of the recovered nifH ASV’s closest nifH reference sequence was the copy from that relative (dark square) or the lowest common taxonomic rank shared with that relative. Tree rooted to 16S rRNA gene from Methanocaldococcus jannaschii (GenBank accession no. NR_113292). †: 15N-incorporator shared equal sequence identity to M. methanicus and M. superfactus. The 16S rRNA gene sequence from M. methanicus was used for tree construction and the metabolic profiles for both organisms are shown. ‡: nifH sequence not available at the time of analysis.

