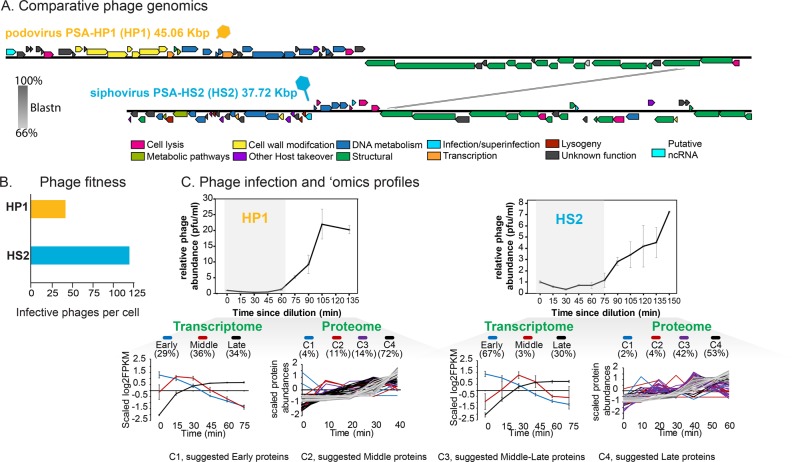
Fig. 1. Podophages PSA-HP1 (HP1) and PSA-HS2 (HS2).
a Blastn-based phage genome comparison. b Phage fitness on Pseudoalteromonas str. 13–15, defined as number of infective phages produced per cell. c Temporal dynamics of phage infection (0 = 15 min after phage addition) to measure latent periods and ‘omics profiles. Transcriptome: average and standard deviation of scaled gene expression classified as early (blue), middle (red), or late (black). Proteome: detected proteins and their scaled abundances, colored following the transcript clusters. Parentheses contain either the fraction of total genes expressed or of proteins detected. Pfu particle forming units.

