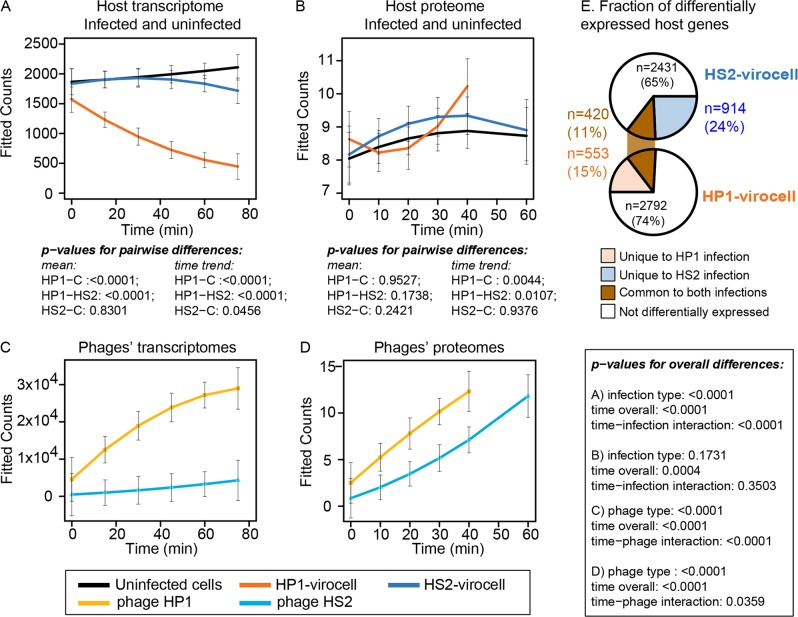
Fig. 2. Host global transcriptome and proteome takeover by phage.
a Temporal fitted raw transcript counts for uninfected controls, HP1 infected (HP1 virocell), and HS2-infected (HS2 virocell) cells. b Temporal fitted protein counts for uninfected controls, HP1 virocells, and HS2 virocells. Temporal fitted raw transcript (c) or protein (d) HP1 and HS2 counts. For all, p values indicate confidence from the ANOVA analysis of a linear model predicting the counts with sample type (uninfected, HP1 infected, or HS2-infected cells), a linear and quadratic function of time, interaction between infection type and time, and the between-sample pairwise comparisons. The error bars indicate 95% Bonferroni-corrected simultaneous confidence intervals for the fitted response. All pairwise comparisons are multiple-comparison corrected using Tukey’s method. Time (min) = 0 indicates 15 min after diluting the infection. e Host genes differentially expressed with and without each phage.

