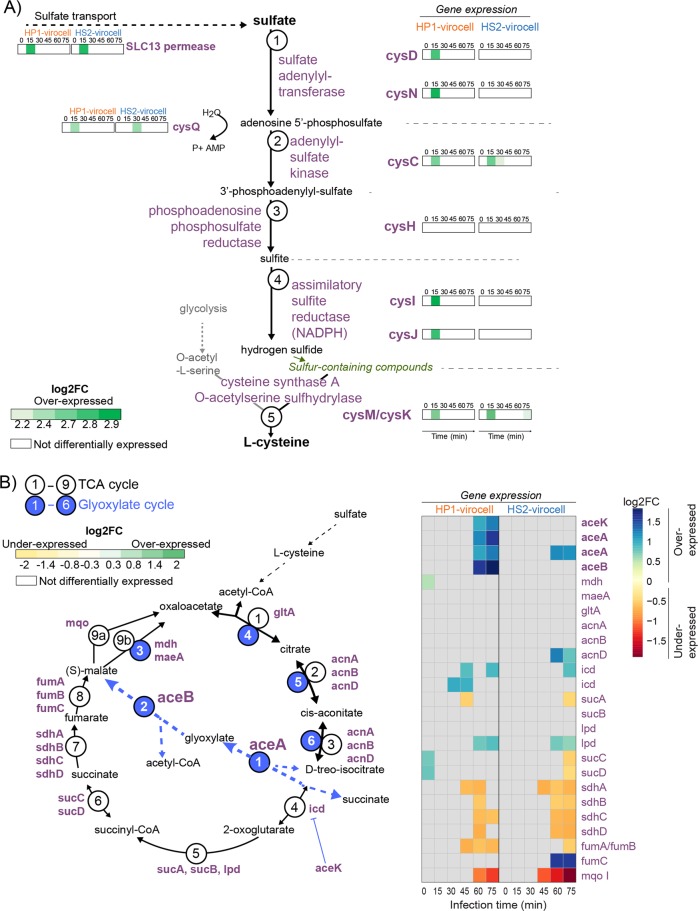
Fig. 5. Phage-specific energy metabolism rewiring in virocells.
a Sulfate intracellular transport and reduction to hydrogen sulfide, for cysteine production. Enzyme gene expression is shown as log2-fold change (log2FC; comparing infected vs uninfected). b The TCA cycle (black) with its glyoxylate bypass (blue), for the presumed consumption of cysteine. Each enzyme and its expression (log2FC in infected vs uninfected cells) is shown on the heatmap. For both, protein dynamics are represented in Fig. S7. For all expression, absence of virocell differential expression has white/gray background.

