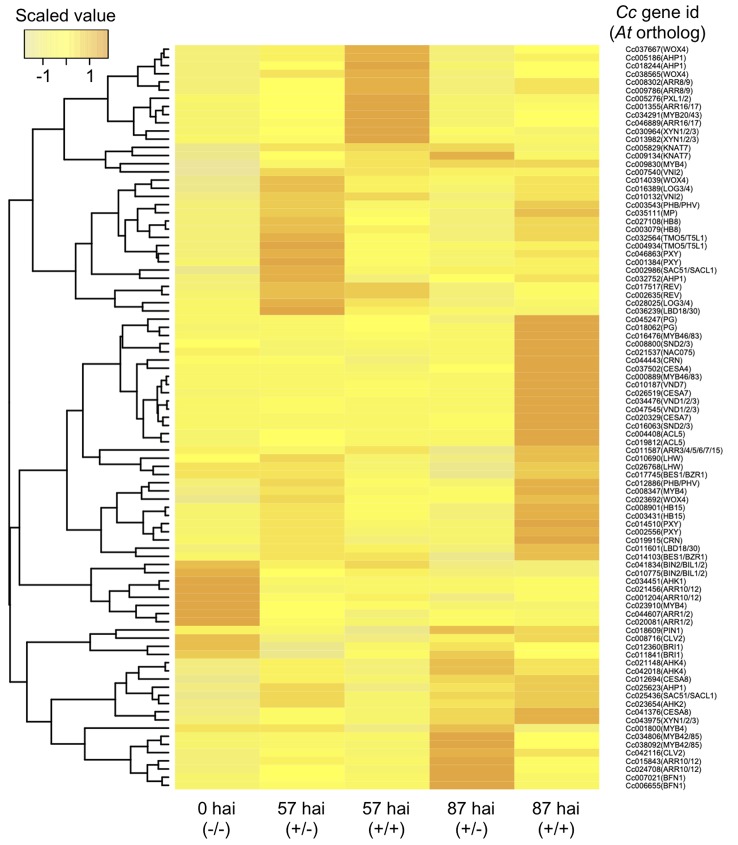
Figure 7.
Hierarchical clustering of C. campestris orthologous genes with biological functions putatively related to vascular development in A. thaliana. Transcript per million data from RNA-seq results of the in vitro induction system were normalized, and relative gene expression levels among the five samples are visualized in a heat map image according to the color scale shown in the left-hand panel. Samples were taken 57 or 87 hours after induction (hai) with pressure in the absence (+/−) or presence (+/+) of an A. thaliana rosette leaf and designated here as 57 hai (+/−), 57 hai (+/+), 87 hai (+/−), and 87 hai (+/+), respectively. For control, samples containing epidermal and cortical cells of C. campestris stem were taken at the onset of the induction and designated as 0 hai (−/−). hai, hours after induction.

