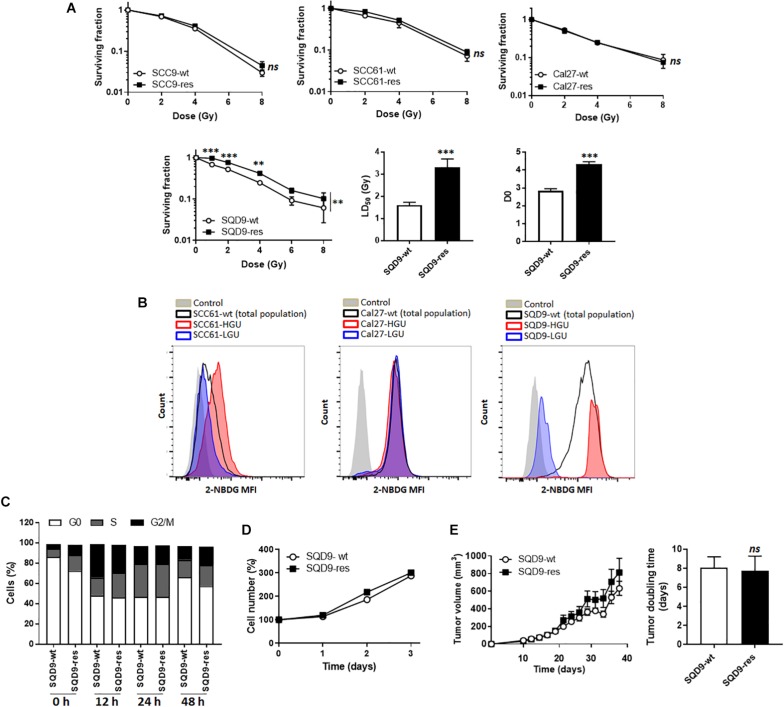
FIGURE 1.
Model selection. (A) From left to right: surviving fractions of SCC9-wt versus SCC9-res (n = 3), SCC61-wt versus SCC61-res (n = 3), Cal27-wt versus Cal27-res (n = 2) and SQD9-wt versus SQD9-res cells (n = 6). For SQD9-wt and SQD9-res cells, two additional graphs show the lethal dose 50 (LD50) and the D0 dose (n = 6). (B) Wild-type cells were FACS-sorted to isolate the 2% subpopulation of cells with the highest uptake of glucose analog 2-NBDG (HGU cells) and the 2% subpopulation with the lowest 2-NBDG uptake (LGU cells). The representative images were acquired after 2 weeks of culture following FACS sorting. They show counts in function of 2-NBDG mean fluorescence intensity for SCC61, Cal27 and SQD9 cells. Control corresponds to untreated cells. (C) Cell cycle analyzed over time (h) after a 8 Gy irradiation (n = 2). (D) Cell number measured over time in non-irradiated cells (n = 8). (E) SQD9-wt and SQD9-res in vivo tumor growth is shown on the left graph and tumor doubling times on the right graph. Tumors were not irradiated (n = 11–12). ∗∗P < 0.01, ∗∗∗P < 0.005, ns P > 0.05 by two-way ANOVA followed by a Sidak’s multiple comparison test (A) or Student’s t-test (A LD50 and D0; E right).

