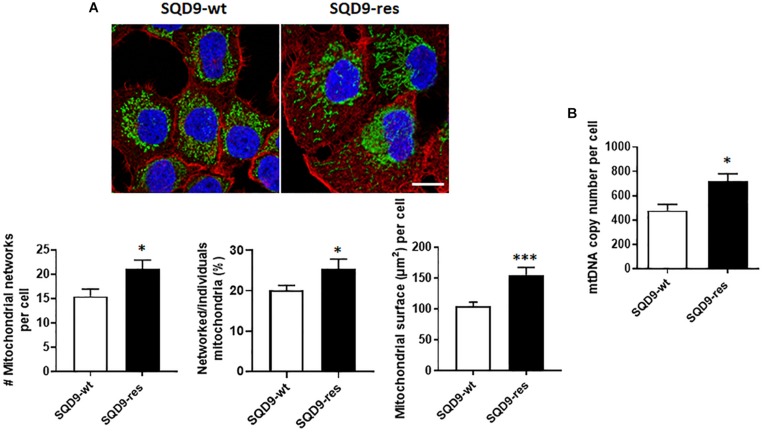
FIGURE 10.
Mitochondrial abundance and morphology differ between radiosensitive and radioresistant SQD9 cells. (A) Mitochondria were labeled with an anti-Tom20 antibody (green), the cytoskeleton with an anti-actin antibody (red) and cell nuclei with DAPI (blue). Representative pictures are shown on top (bar = 20 μm), and graphs show the number of mitochondrial networks per cell (left), the ratio of networked/individual mitochondria (middle) and the relative surface of cells occupied by mitochondria (MitoFootprint, right) (n = 20–34). (B) mtDNA content normalized to nuclear DNA content (n = 8). ∗P < 0.05, ∗∗∗P < 0.005 by Student’s t-test.

