FIGURE 2.
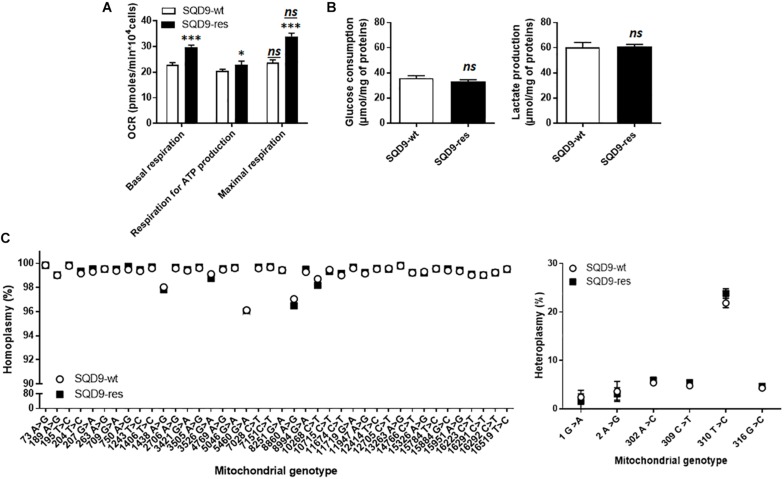
Acquired radioresistance of SQD9 cells correlates with increased mitochondrial respiration. (A) OCRs corresponding to basal respiration, maximal respiration and the oxidative contribution to ATP production (n = 24). (B) Glucose consumption (left) and lactate production (right) 72 h after cell seeding (n = 8–9). (C) mtDNA was sequenced. The left graph shows the comparative distribution of homoplasmic variants and the right graph heteroplasmic variants (n = 4). ∗P < 0.05, ∗∗∗P < 0.005, ns P > 0.05 for the same parameter between SQD9-wt and SQD9-res; ns P > 0.05 versus basal respiration of the same cell line; by Student’s t-test (A–C).

