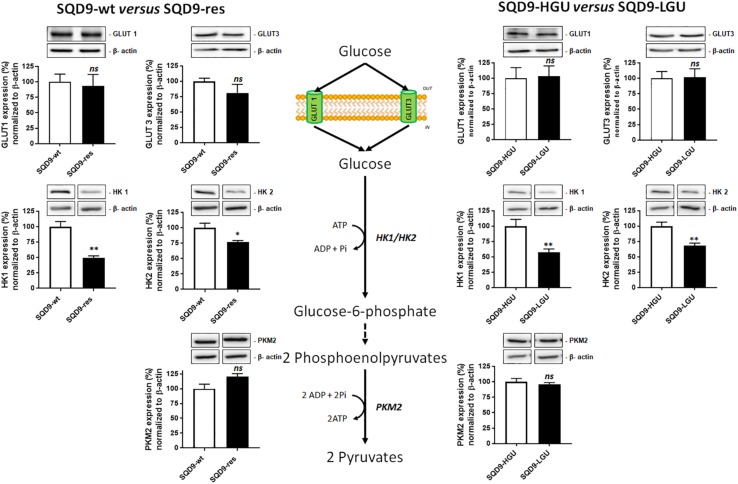
FIGURE 5.
Oxidative SQD9-res and SQD9-LGU cells are characterized by a glycolytic bottleneck at the level of hexokinases. The figure depicts glycolysis where glucose transporters GLUT1 and GLUT3 facilitate glucose uptake by cancer cells, hexokinases 1 and 2 (HK1 and HK2) catalyze glucose phosphorylation to yield glucose-6-phosphate, and pyruvate kinase M2 (PKM2) the conversion of phosphoenolpyruvate to pyruvate. The expression of the 2 transporters and the 3 enzymes was analyzed using western blotting in SQD9-wt versus SQD9-res (on the left) and in SQD9-HGU versus SQD9-LGU (on the right). On top of each quantification graph, representative pictures were each time produced on a same membrane (n = 4–6). ∗P < 0.05, ∗∗P < 0.01; ns P > 0.05; by Student’s t-test.

