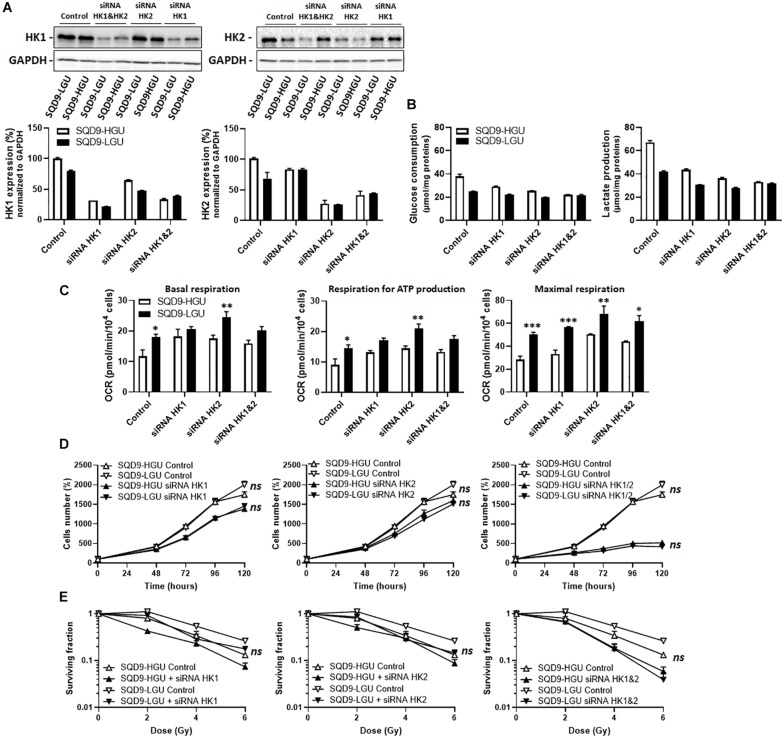
FIGURE 7.
Silencing hexokinases in SQD9-HGU and SQD9-LGU cells. (A–E) SQD9-HGU and SQD-9-LGU cells were lipofected with a cocktail of siRNAs targeting either HK1 or HK2 or both together. (A) Representative western blots show the expression of HK1, HK2 and GAPDH, which is quantified in the graphs (n = 2). (B) Glucose consumption (left) and lactate production (right) 72 h after cell seeding (n = 2). (C) OCRs corresponding to basal respiration, maximal respiration and the oxidative contribution to ATP production (n = 3–5). (D) Cell number measured over time (n = 4). (E) Clonogenic assay after irradiation at the indicated doses, where the graphs show surviving fractions (n = 4). *P < 0.05, **P < 0.01, ***P < 0.005, ns P > 0.05 by student’s t-test (C) or by two-way ANOVA followed by a Sidak’s multiple comparison test (D,E).

