
Fig. 3.
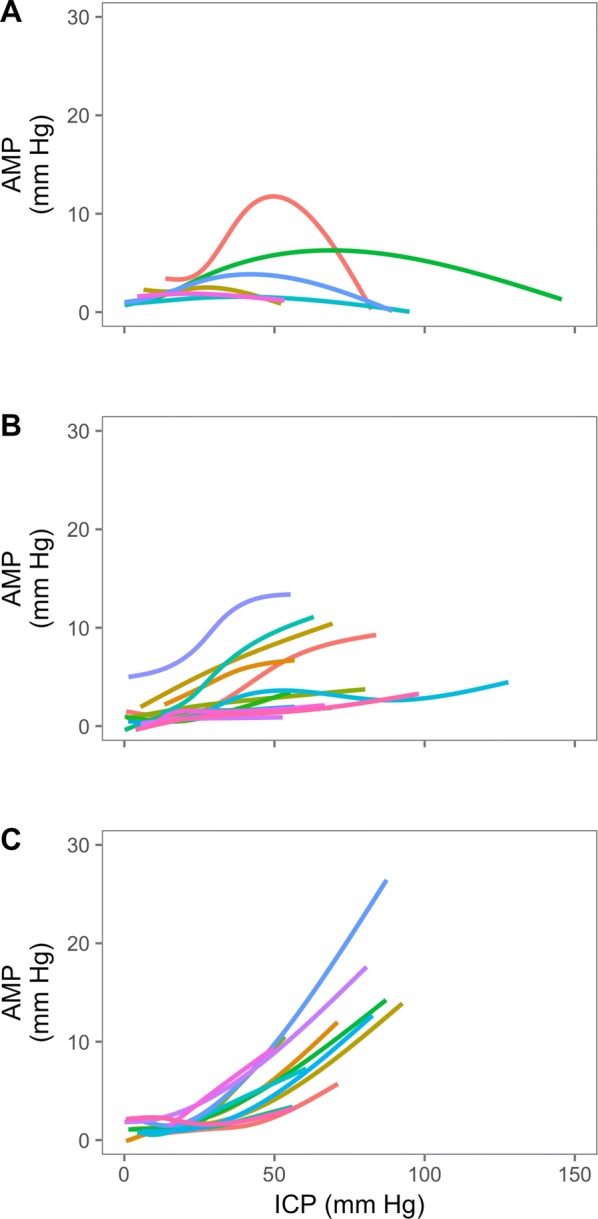
The ICP amplitude—mean ICP relationship (n = 33). Three distinct patterns were identified; those with an upper breakpoint (A, n = 6), a rightward deflected pattern (B, n = 13) or those with a monotonic increasing pattern (C, n = 12). In 2 patients, AMP decreased with increasing ICP (not shown). ICP intracranial pressure; AMP pulse amplitude of ICP