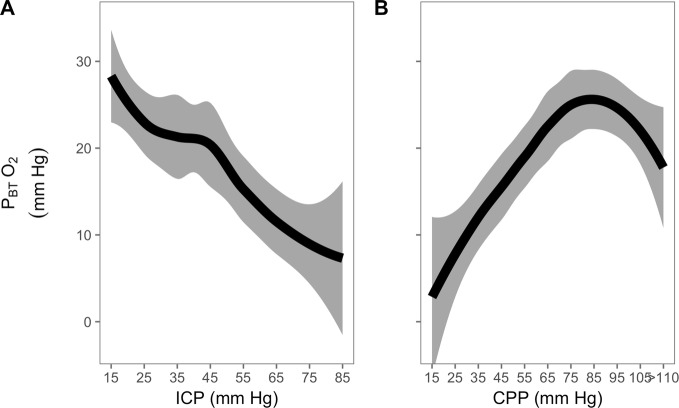
Fig. 5.
PBTO2 response to refractory intracranial hypertension expressed relative to changes in ICP (left) and CPP (right) (LOWESS with 95% confidence interval; n = 9). When expressed against ICP, PBTO2 demonstrates a steady decrease. When expressed in relation to changes in CPP, the relationship resembles the autoregulation curve; with moderate levels of CPP (70- > 90 mm Hg), oxygenation is well maintained, but lower than 70 mm Hg, oxygenation decreases (by approximately 0.5 mm Hg per 1 mm Hg decrease in CPP. PBTO2 brain tissue oxygenation; ICP intracranial pressure; CPP cerebral perfusion pressure

