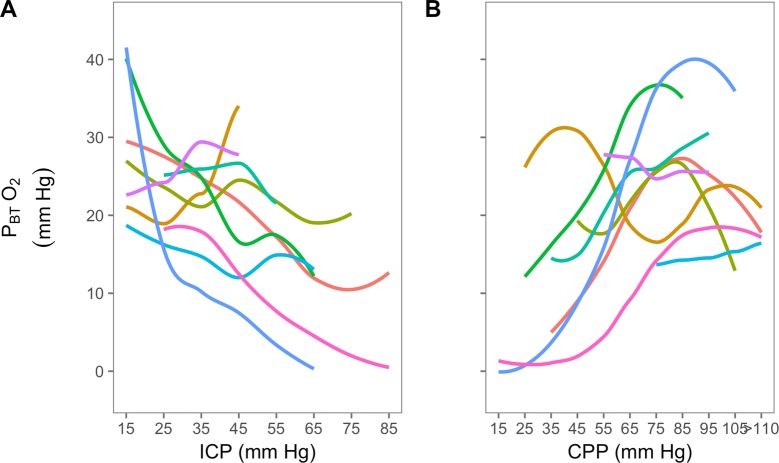
Fig. 8.
Individual PBTO2 response to refractory intracranial hypertension expressed relative to changes in ICP (left) and CPP (right) (n = 9). Brain tissue oxygenation response to increases in ICP showed marked variability between patients with some patients showing relatively preserved PBTO2 with increasing ICP, some showing precipitous hypoxia, and some showing a paradoxical increase in oxygenation. A similar variability is observed with respect to CPP. This variability highlights the complex nature of the PBTO2 signal; it is contributed to by respiratory (FiO2, PaO2), hematological (Hb), cardiovascular (cardiac output, cerebral blood flow) and metabolic factors (brain metabolism)

