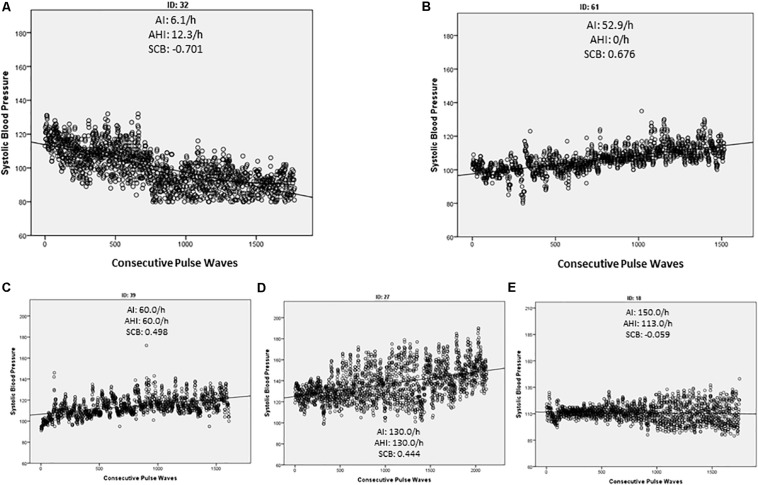
FIGURE 1.
Simple dot blot of each measured pulse wave against the corresponding systolic blood pressure (SBP). The regression line indicates the general direction of the SBP during the observed time period. Arousal index (AI), apnea/hypopnea index, and the calculated standardized coefficient β (SCB) of each demonstrated example are indicated. In controls we found mainly a negative SCB indicating a decrease in the SBP (A) while patients with OSA tended to increase the SCB (C,D). However, an increase in the SBP was also detected in the absence of a significant OSA (AHI > 15/h) if sleep fragmentation was present (B). In some OSA patients, the SCB kept stable and only the variance of the SBP increased (E).

