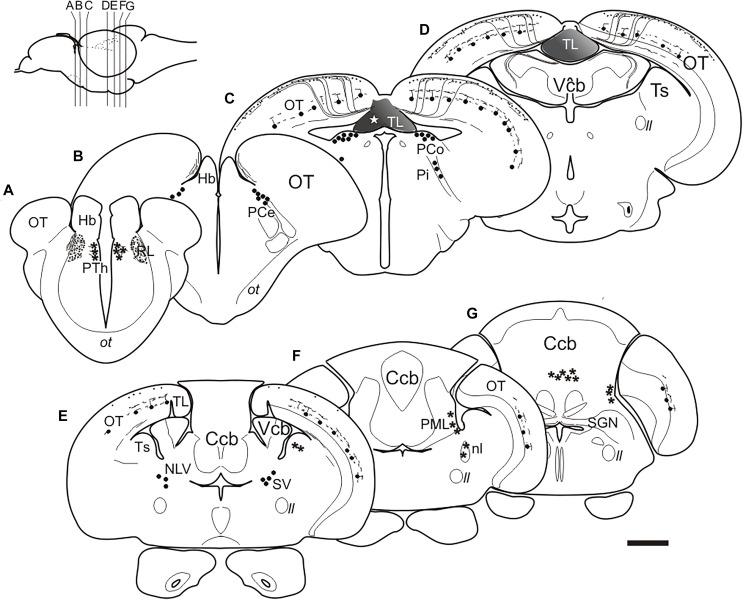
FIGURE 5.
(A–G), Schematic drawings of selected transverse sections of the brain of adult zebrafish from rostral to caudal at the levels indicated in the inset, showing the results of DiI application to the intermediate TL (star). Circles, cells labeled consistently; asterisks: cells labeled occasionally; lines and dots, labeled fibers. Dashed lines: areas of the brain. For abbreviations see the list. Scale bar for sections: 200 μm.

