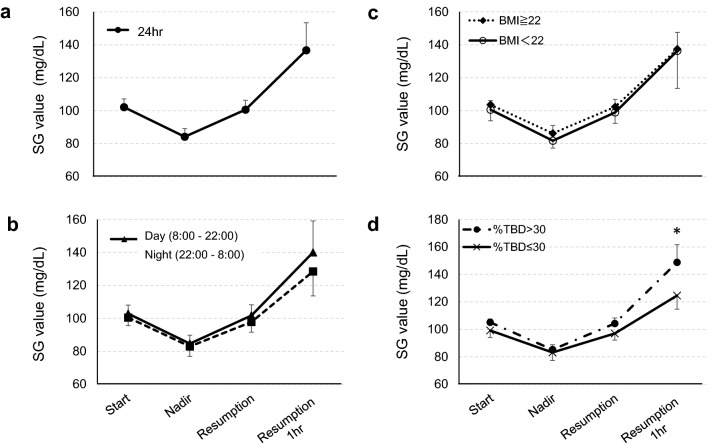
Fig. 2.
The change in the SG value during suspension and after resumption of insulin infusion. a All PLGM data, b classified by event starting time: daytime and night-time. The differences between day and night are not significant. c Classified by the BMI of patients. The differences between high BMI group and low BMI group are not significant. d Classified by %TBD of patients. The SG value at resumption 1 h was significantly higher in the high %TBD group than in the low %TBD group. SG sensor glucose, All data are presented as the mean ± standard deviation (SD). *Statistically significant, P < 0.05

