
Figure 4.
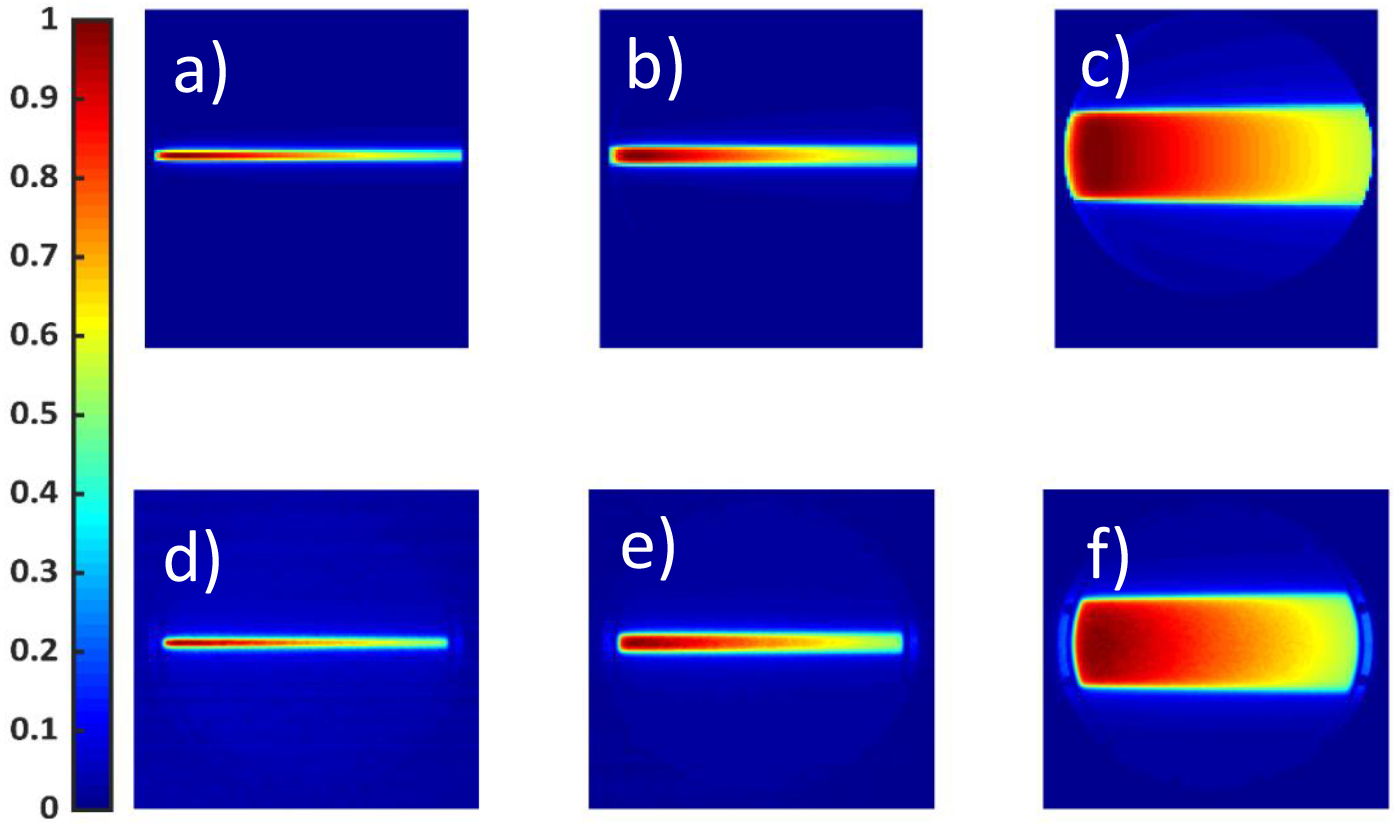
a), b) and c) show projected dose distributions obtained from the TPS for a 5mm,10mm,50mm square beam, respectively. A total of 500 Monitor Units, at 600MU/min for a 6MV beam, were delivered. d), e) and f) show the corresponding images captured using an intensified CMOS camera. Spatial and temporal filters were applied over the optical images. Both TPS and Optical Images are normalized to their maximum pixel value.