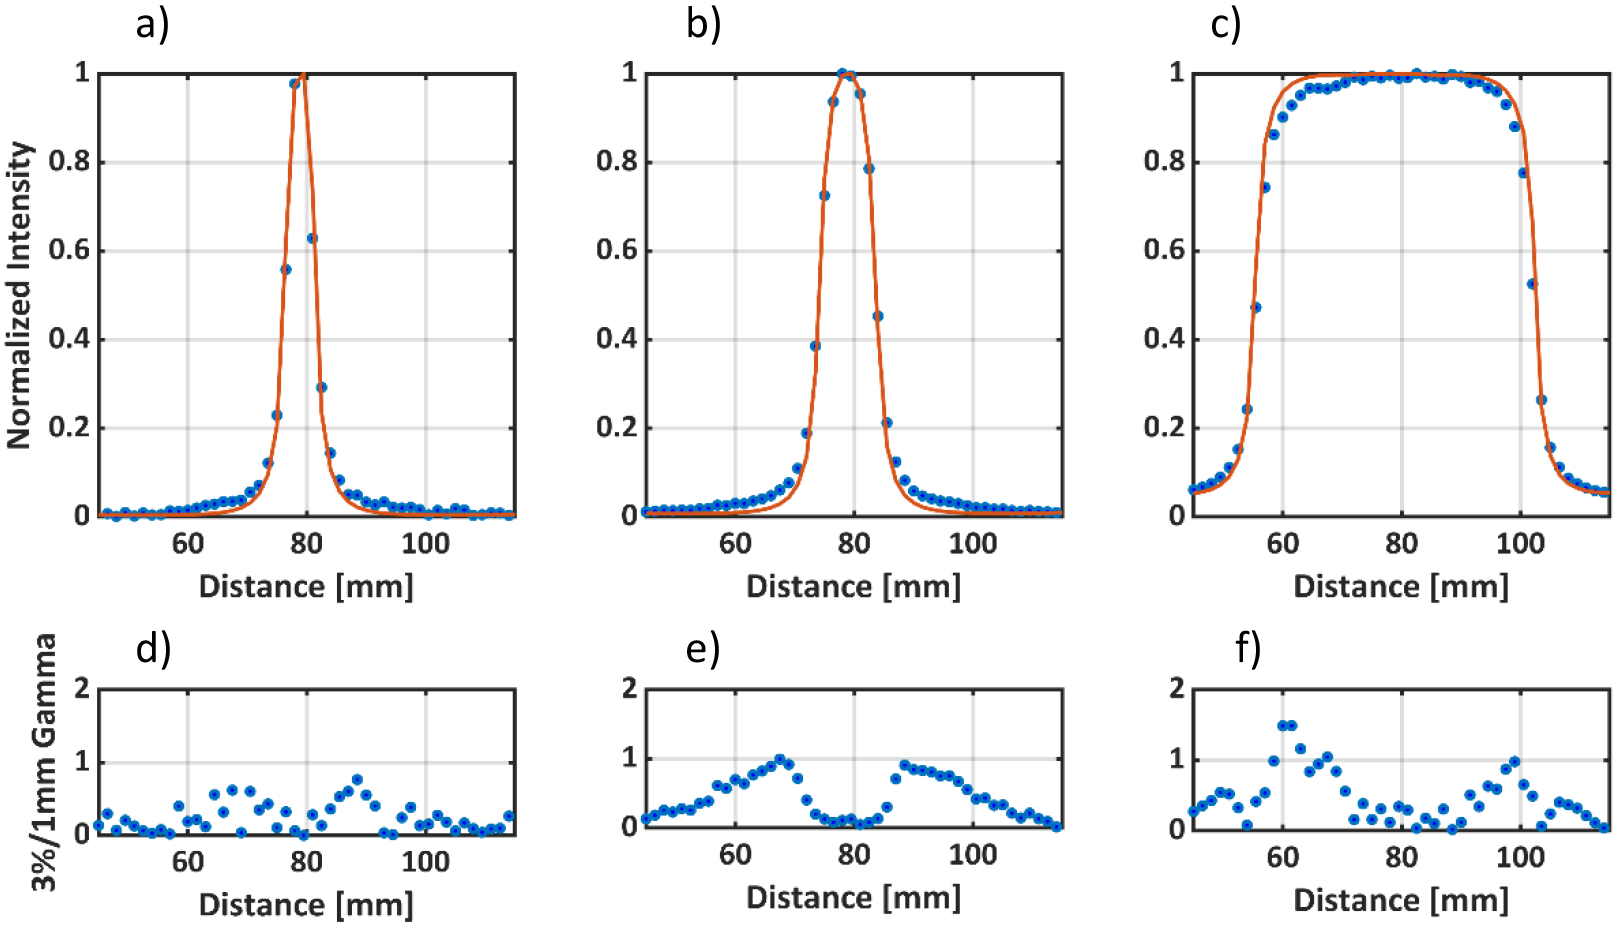
Figure 6:

Cross Beam Profiles at Dmax for a) 5mm, b) 10mm and c) 50mm 6MV square beams. The solid red line represents the TPS data and the blue dots represent the optical data. d), e) and f) represents the 3%/1mm gamma criteria (global normalization) for the optical cross beam profiles for 5mm, 10mm, and 50mm beams respectively with the corresponding TPS data as the reference.
