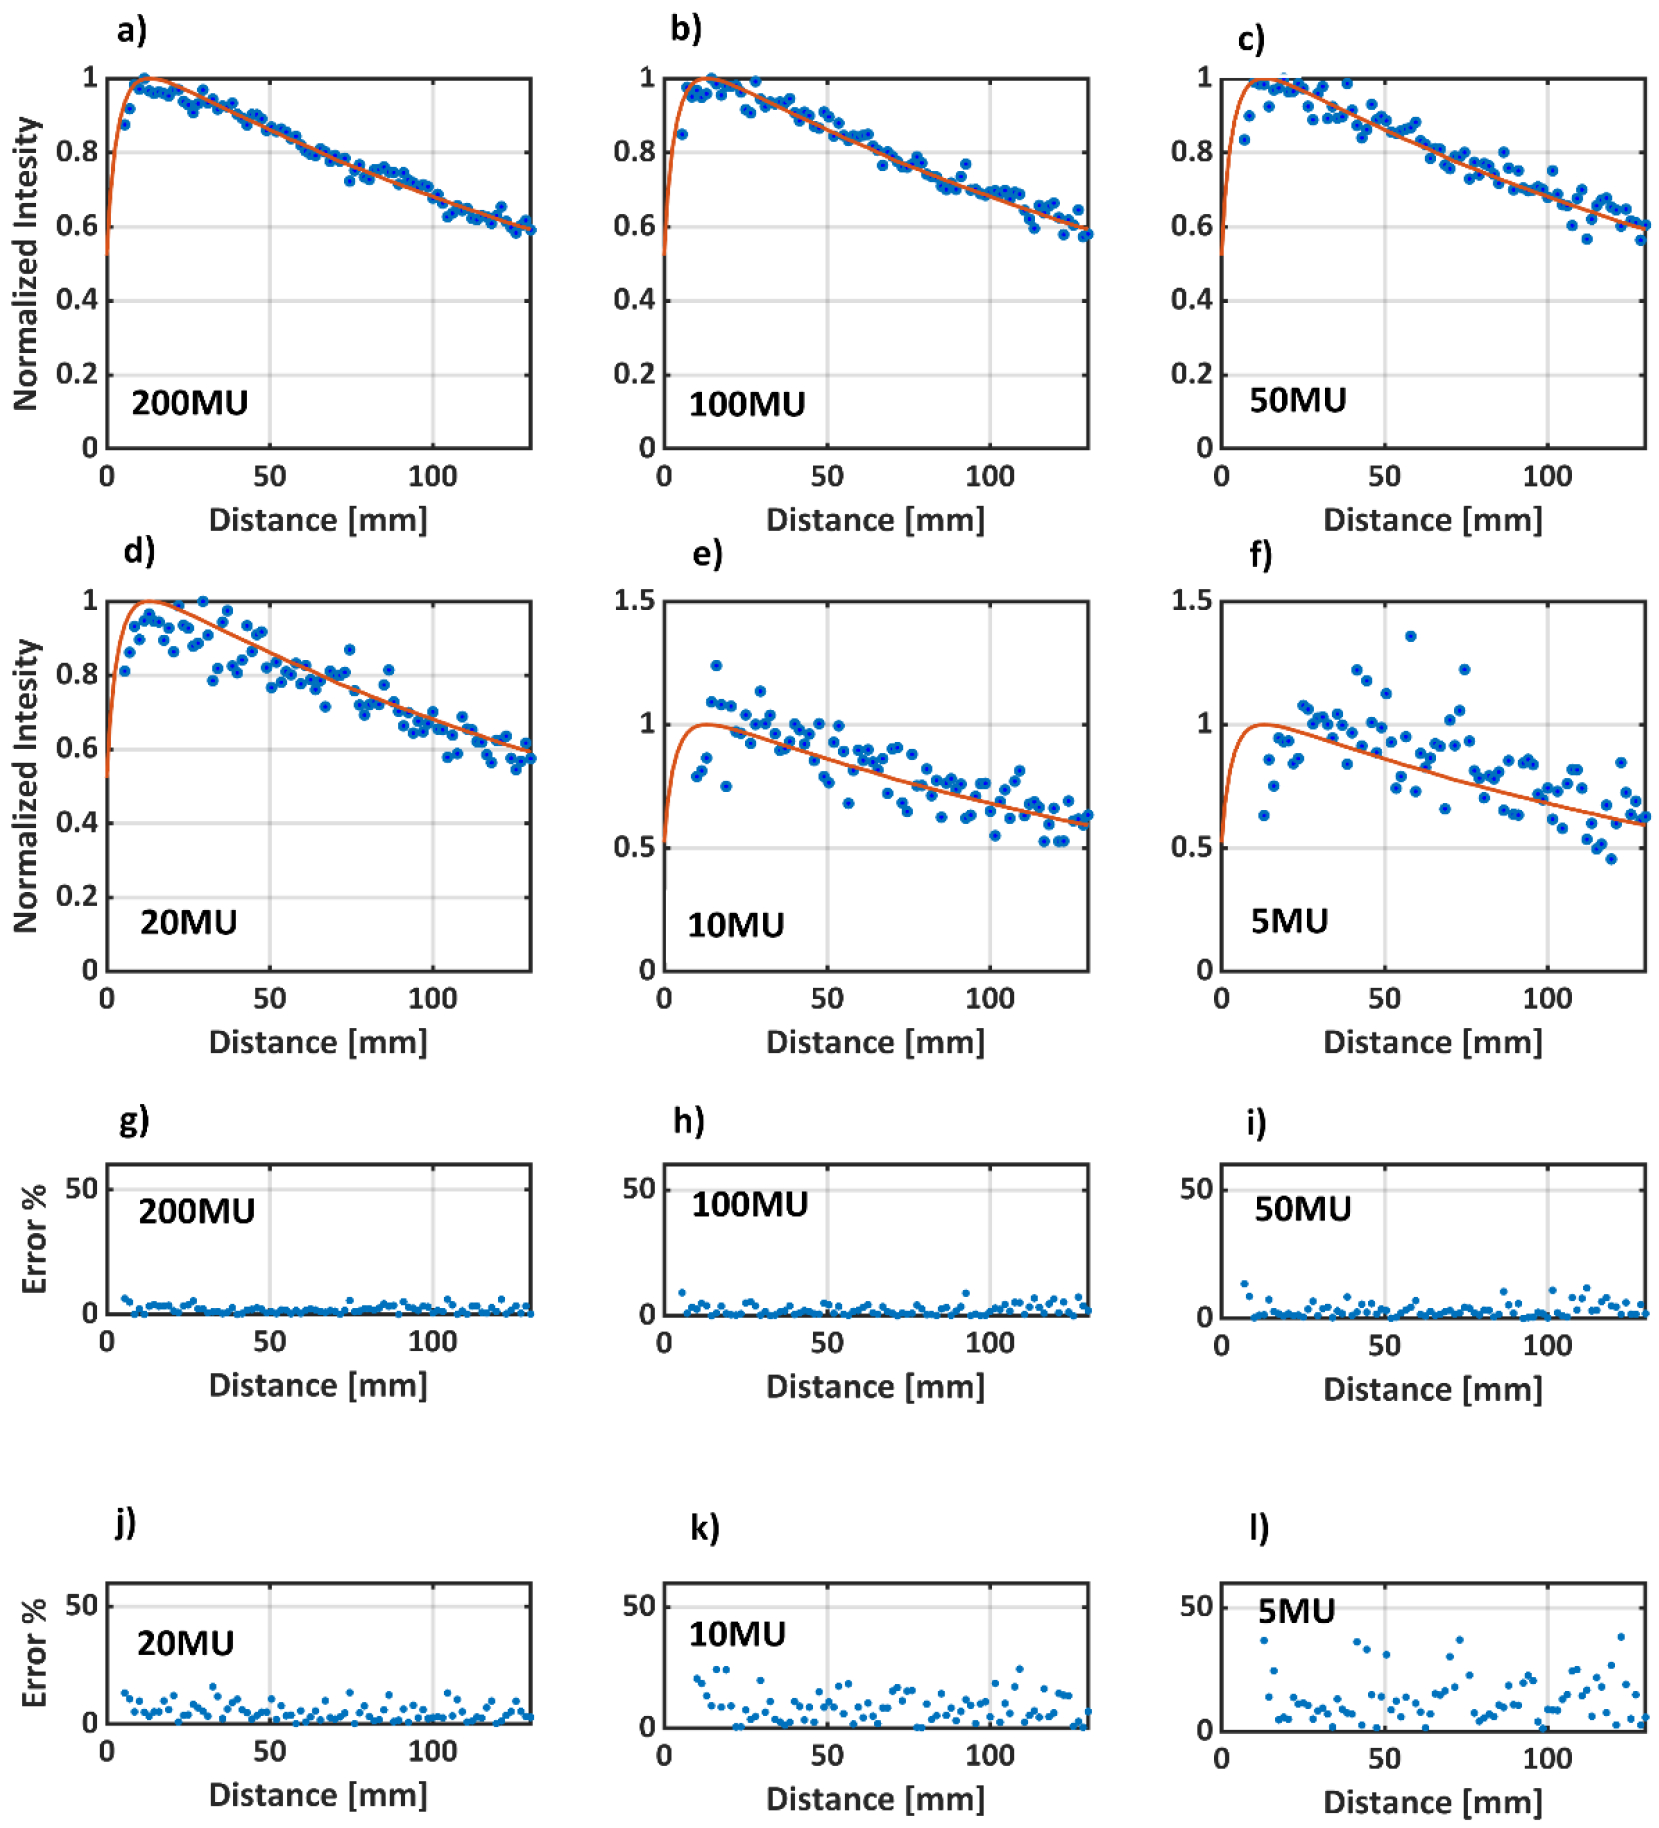
Figure 8.

a) to e) pPDD profiles for a static 5 mm beam with 200, 100, 50,20,10,5 MU, respectively. The solid red line represents TPS data, whereas the blue dots are the optical data. Note that profiles a) to d) are normalized to pDmax, whereas e) and f) are normalized to average of the +/−5 pixels values around pDmax. g) to l) show the percentage error between TPS and optical data for 200, 100, 50,20,10,5 MUs, respectively. The average errors for the different number of MU’s are as follow:
200MU: 2.0±1%, 100MU:2.5±2%, 50MU:3.5±3%, 20MU:5.5±3%, 10MU:8.1±5%, 5MU:18.6±11%
