Figure 1.
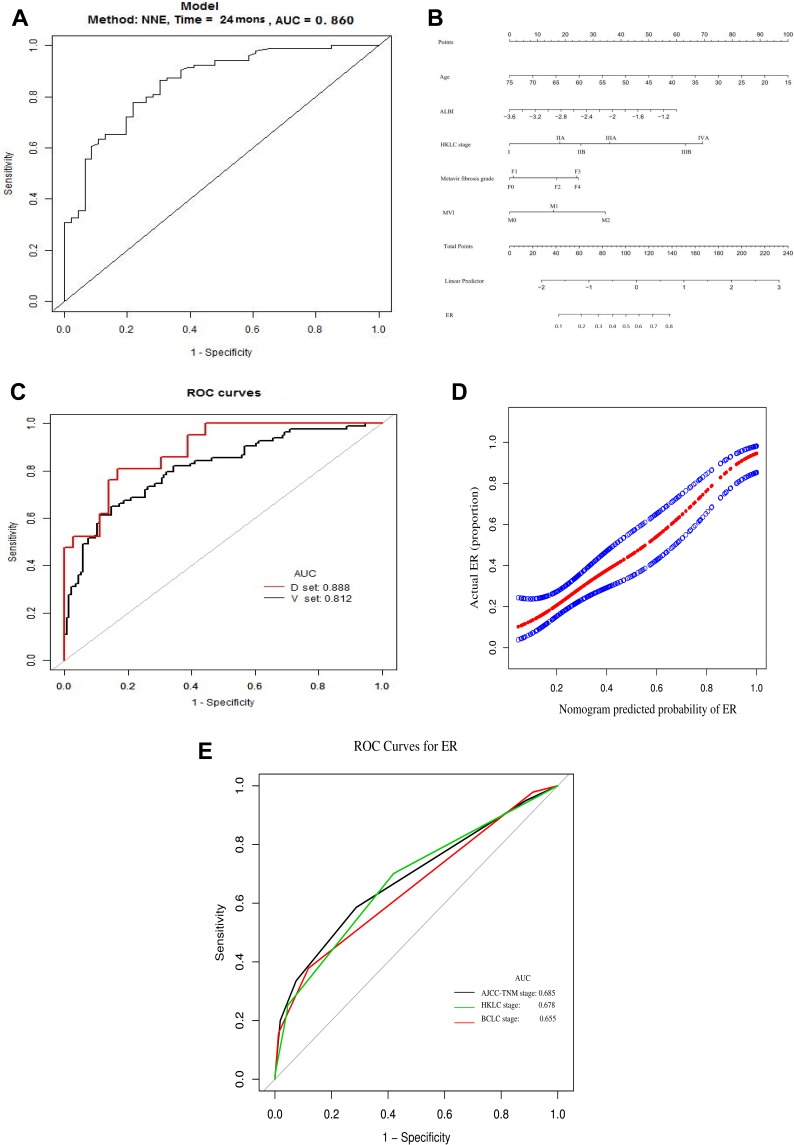
(A) AUC (0.860) of ROC used to predict ER; (B) nomogram used to predict ER. The value of each patient is presented on the axis for each variable in the nomogram. A line was drawn upward to determine the number of points allocated to each variable. (C) Internal validation of ER. Using Bootstrap analysis, 75% of all patients were randomly selected 2000 times for internal validation. The AUC of ER in the development set (D-set) was 0.888, while that in the validation set (V-set) was 0.812. (D) Calibration curve yielded by C-index analysis [0.7794 (95% CI, 0.6456–0.9132)], with strong consistency being obtained between the prediction cohort (x-axis) and the actual observation cohort (y-axis) for the probability of ER. (E) ROC curve used to evaluate the ability to predict HCC staging system for postoperative ER.

