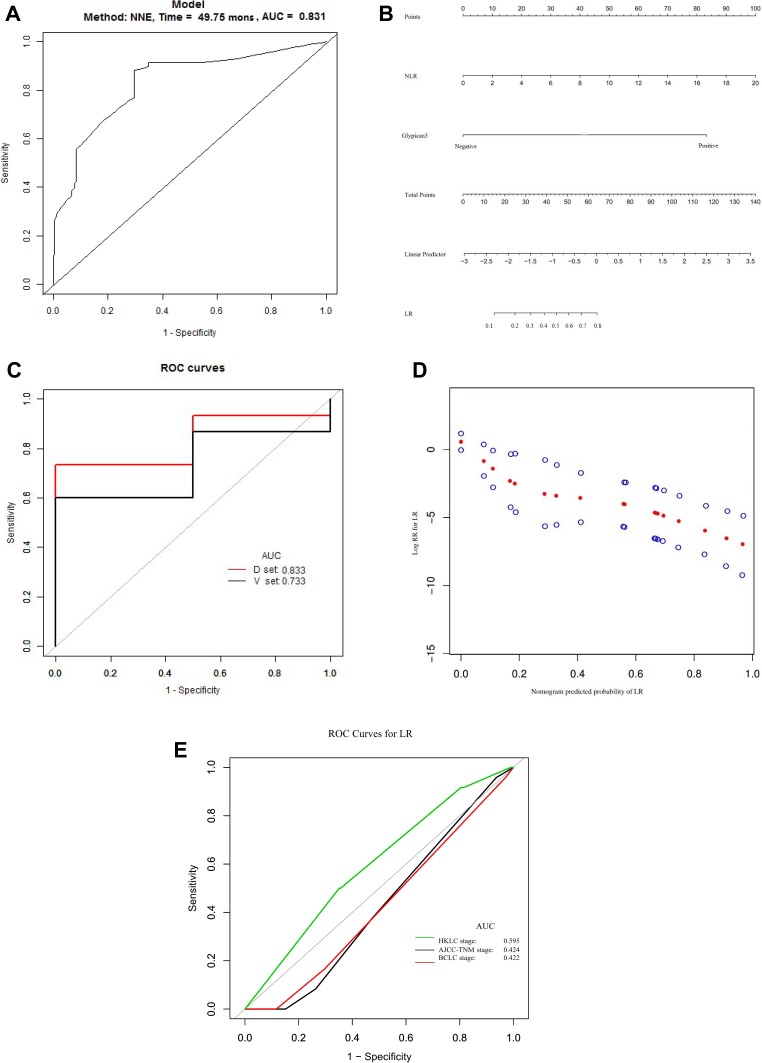
Figure 2.
(A) AUC (0.831) of ROC curve used to predict LR. (B) Nomogram used to predict LR. The value of each patient is presented on the axis for each variable in the nomogram. A line was drawn upward to determine the number of points allocated to each variable. (C) Internal validation of LR prediction. Using Bootstrap analysis, 75% of all patients were randomly selected 2000 times for internal validation. The AUC of LR prediction in the development set (D-set) was 0.833, while that in validation set (V-set) was 0.733. (D) Calibration curve yielded by C-index analysis [0.7364 (95% CI, 0.6854–0.7844)], with strong consistency being obtained between the prediction cohort (x-axis) and the actual observation cohort (y-axis) for the probability of LR. (E) ROC curve used to evaluate the ability to predict of HCC staging system for postoperative LR.

