
Figure 8.
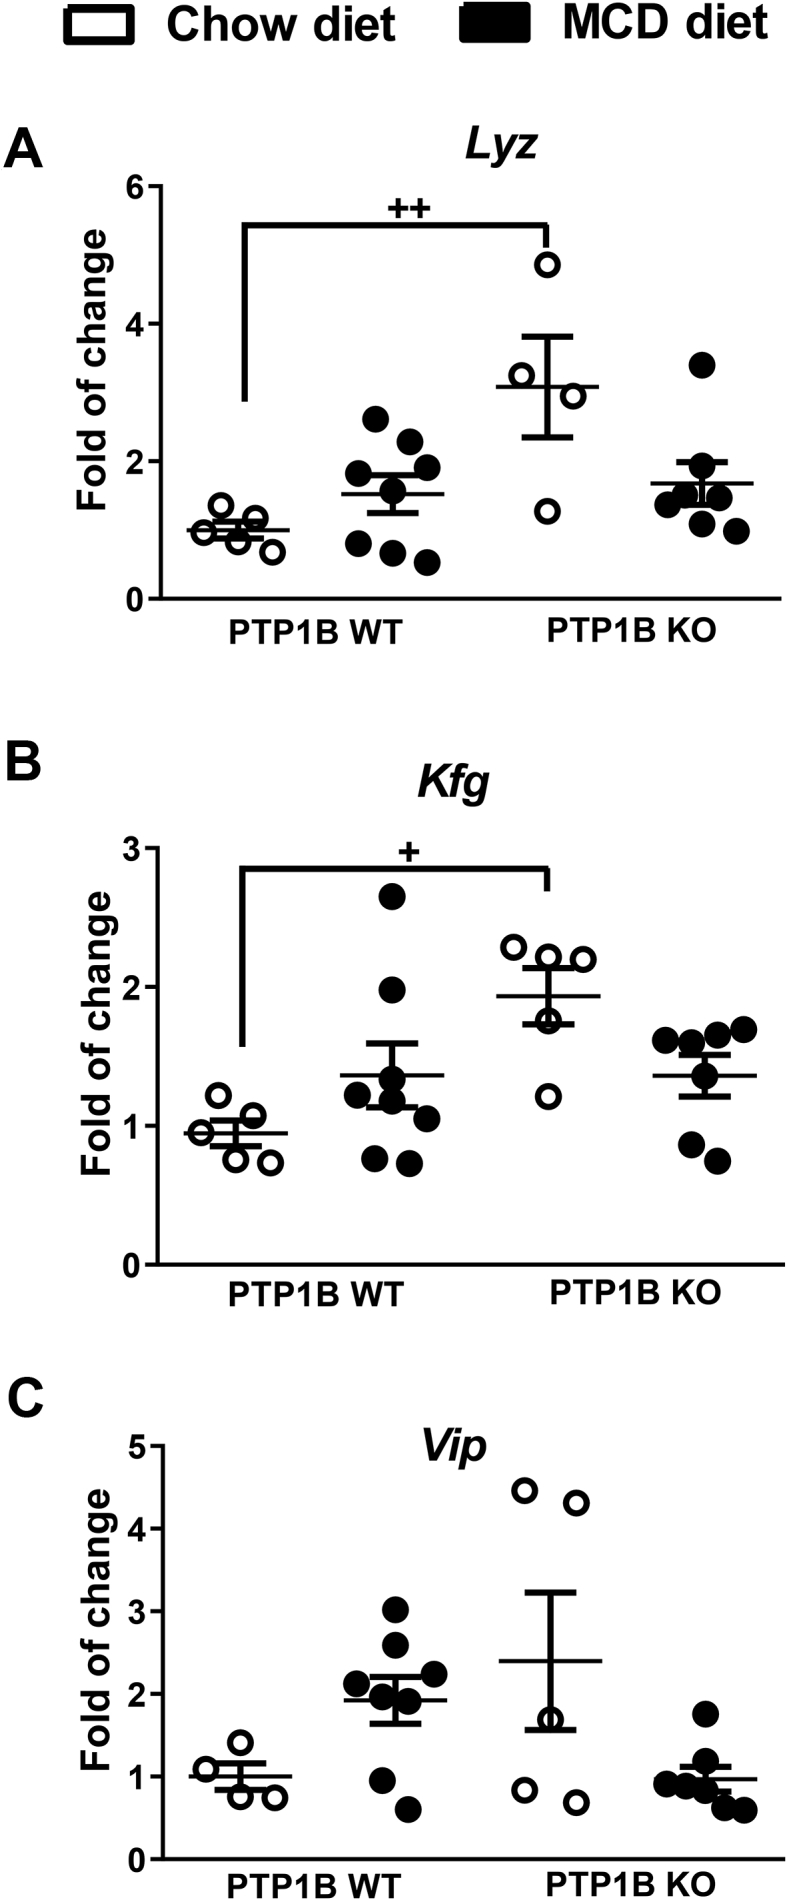
mRNA expression levels of GLP-2 responsive genes in colon samples of PTP1B WT and PTP1B KO mice under NASH conditions. A-C) Lyz (lysozyme), Kfg (keratinocyte growth factor), and Vip (vasointestinal peptide) mRNA levels are shown as fold change referred to the control PTP1B WT fed a chow diet. White dots correspond to mice fed a chow diet, and black dots correspond to mice fed a MCD diet. Data are expressed as mean ± SEM. n = 4–8 animals per experimental group. +p< 0.05; ++p < 0.01 PTP1B WT chow diet vs PTP1B KO chow diet.