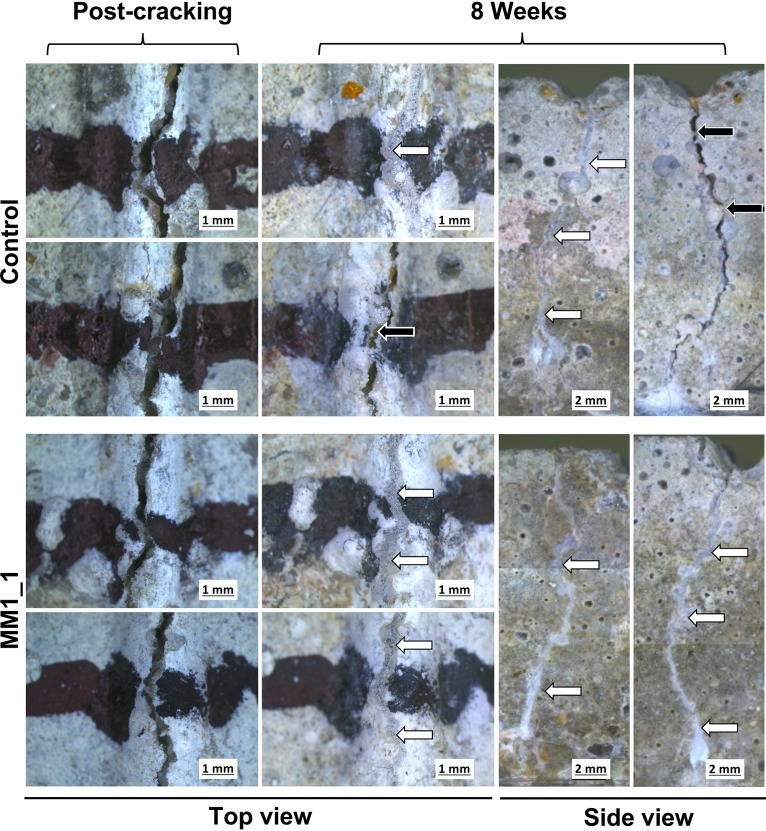
FIG 7.
Crack closure in control mortars and in mortars containing nonureolytic bacteria. Cracks in mortar specimens are shown immediately postcracking and after 8 weeks of healing. Cracks were marked with black pen to allow the same region to be monitored over time. Two independent regions along the top of the mortar were monitored per sample. Side views show the cracks down both sides of the mortar at 8 weeks. White arrows, complete crack closure; black arrows, incomplete crack closure. Image manipulations were restricted to adjusting contrast and exposure. Due to the limited imaging area of the camera, side-view images were manually assembled from multiple photographs of overlapping sections of the specimen.

