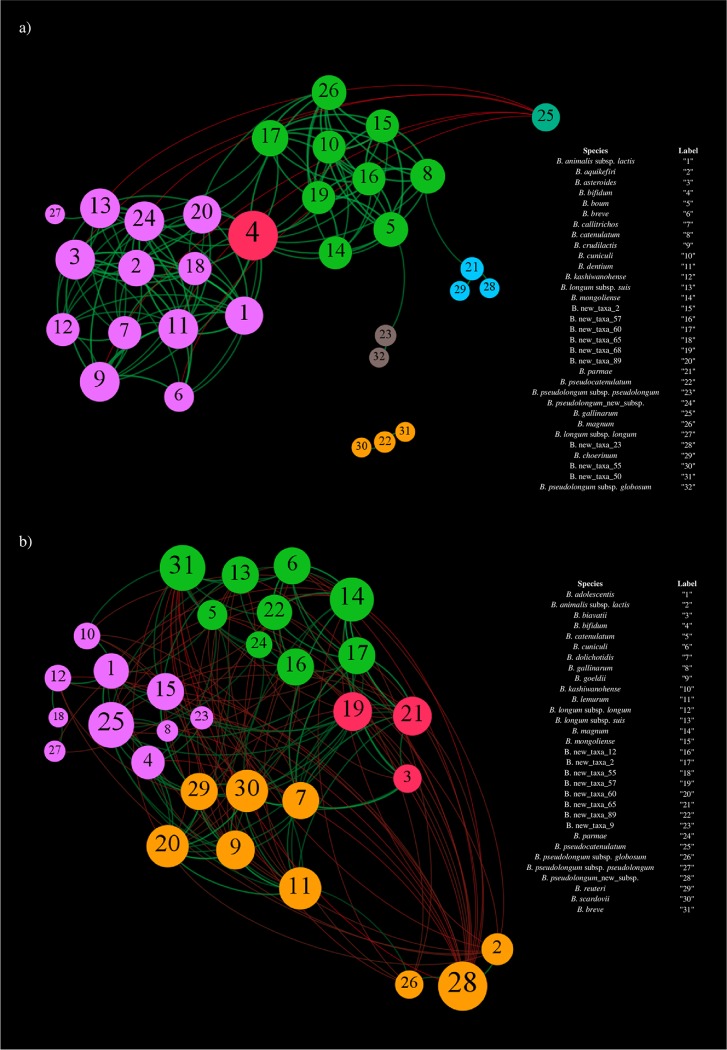
FIG 2.
Covariance network of the most abundant bifidobacterial species of feline and canine fecal microbiota. (a) Force-driven network obtained by considering the bifidobacterial species with an average relative abundance of ≥0.05% of the feline fecal samples. (b) Force-driven network constructed by considering the bifidobacterial taxa with an average relative abundance of ≥0.3% of the canine fecal samples. In both cases, the force-driven networks exhibit the predicted c-variances with a P value of <0.05 between the profiled bifidobacterial species. Moreover, the node size is proportional to the number of covariances, while the node color indicates the different observed clusters.

