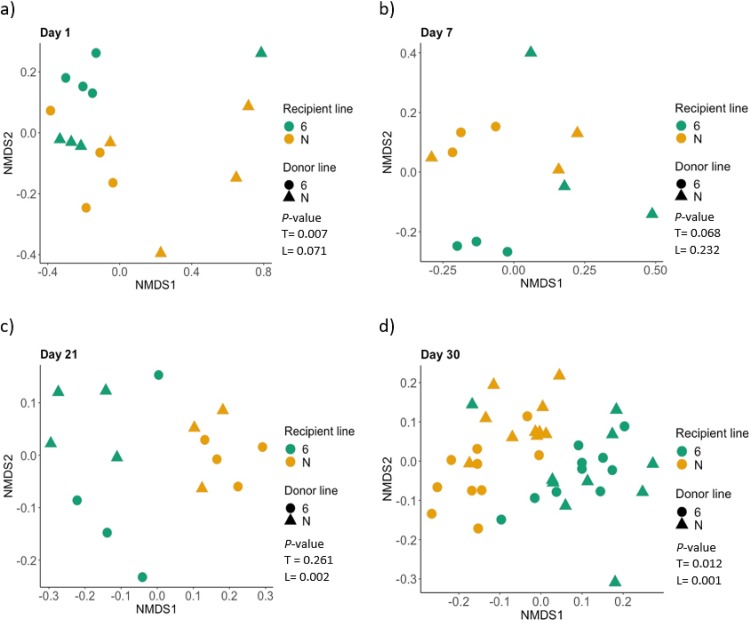
FIG 6.
Cecal microbiota transplants influenced the composition of the microbiota early in the experiment, but bird line had a dominant effect with increasing age. NMDS plot of gut microbiota at each time point: day 1, top left; day 7, top right; day 21, bottom left; day 30, bottom right. P values for the effect of the transplant (T) or the bird line (L) were obtained using the adonis test and are presented in the key for each plot.

