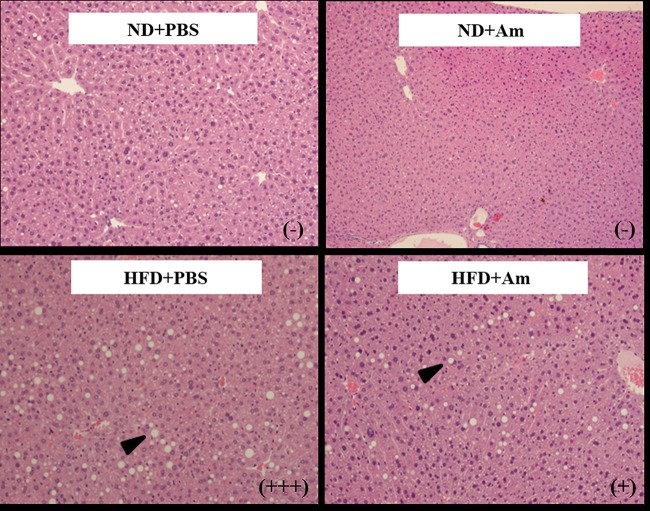
FIG 1.
Histological analysis of liver tissues stained with hematoxylin and eosin (×100). ND+PBS, 10% fat diet with phosphate-buffered saline (PBS); ND+Am, 10% fat diet with Akkermansia muciniphila; HFD+PBS, 45% fat diet with PBS; and HFD+Am, 45% fat diet with A. muciniphila. Images are representative of two independent experiments. Levels of liver injury were determined based on the International Harmonization of Nomenclature and Diagnostic Criteria for Lesions in Rats and Mice (INHAND). Grades for fatty change are showed as symbols in parentheses, as follows: −, unremarkable; +, mild; +++, marked.

