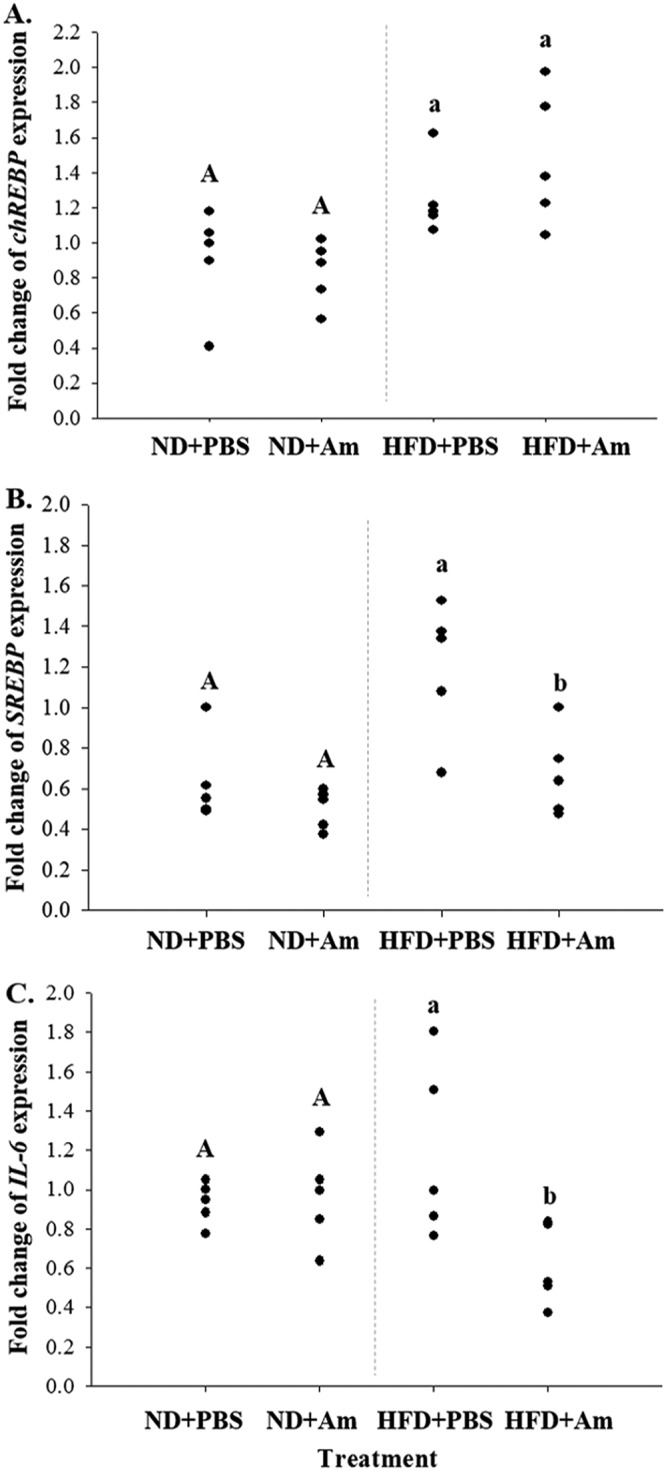
FIG 2.

Relative expression levels of fat synthesis-related genes chREBP (A) and SREBP (B) and inflammatory gene IL-6 (C) in liver tissues. ND+PBS, 10% fat diet with phosphate-buffered saline (PBS); ND+Am, 10% fat diet with Akkermansia muciniphila; HFD+PBS, 45% fat diet with PBS; and HFD+Am, 45% fat diet with Akkermansia muciniphila. Means with different letters (A, a, and b) are significantly different from each other (P < 0.05; n = 5).
